Diary Entries in English
Recent diary entries
Posted by Baloo Uriza on 31 May 2025 in English.

OBDL but governments like Hungary (homophobia), Isreal (genocide), groups like the Republican Party (every stripe of bigotry imaginable) and companies like Tesla (same) are blanket excluded from using, copying, redistributing or accessing OSM data in any way, shape or form?
My name is Saïd Abou Kharroub, and I’m truly honored to be nominated as a candidate for a 2025 HOT voting member. I’m excited to share a bit about my journey with HOT, my current work in Lebanon, and my aspirations as a voting member.
To me, HOT shows the incredible power of people working together with open data in humanitarian crises. It’s amazing how a global community can use mapping to make a real, life-saving difference. What I really appreciate is HOT’s dedication to empowering local communities and building a space where knowledge and skills are freely shared.
My involvement with HOT became very personal and hands-on through the “Lebanon: Conflict - October 2024” project. I got involved when I arrived in Lebanon in January 2025, taking on the role of Lebanon Local Consultant for HOT’s H2H funded project, “Collaborative Approaches to Mapping Damage in Lebanon.” I’ve also been a strategic advisor for CivAPI.com, a data API provider that includes OpenStreetMap layers like buildings, roads, and infrastructure. This advisory role has given me an even deeper understanding of how crucial data provision is in humanitarian and development work.
In my role in Lebanon, I’ve focused on coordinating local data efforts, engaging with important partners, and advising on data protection, especially given the local context. This work includes:
Organizing and hosting local mapathons to grow the OpenStreetMap community and fill important data gaps for humanitarian response. We’ve already held our first mapathons with the Lebanon Reforestation Initiative, Beirut Arab University and are planning the second with the Beirut Urban Lab.
Working closely with HOT staff and humanitarian partners to address specific infrastructure gaps, often responding to requests from groups like UNOSAT.
Posted by SomeoneElse on 31 May 2025 in English.
Last updated on 12 June 2025.
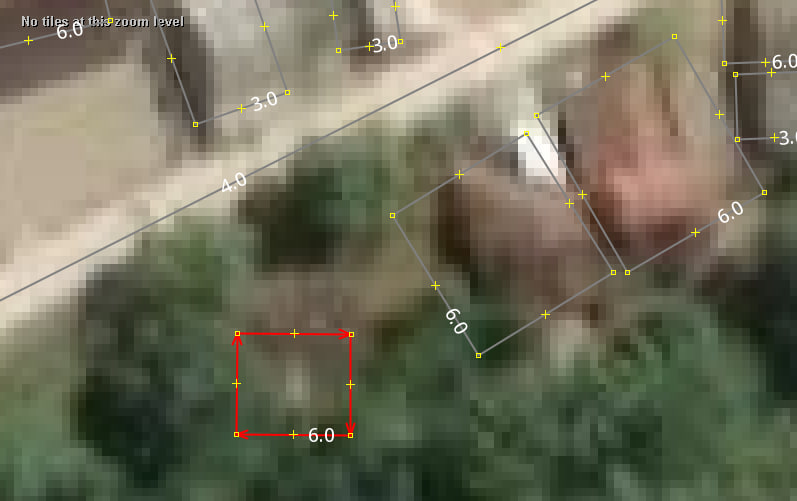
The diameter_crown tag is fairly well used for trees. It’d be nice when showing trees to show larger ones as larger than smaller ones. One challenge is that the values can be a bit hit and miss. There are a couple of sorts of issues there:
One is “obviously silly values from an import gone wrong” like the 289 diameter_crown=width: 2.0; color: green; that have found their way into the database, perhaps by a failed JSON conversion.
Another is “human but not machine readable values” like “4 - 7 m”
Another again is implausible values for certain tree types. For example, this is apparently a London Plane that is 5 times wider than it is high. That’s technically possible with a bit of pruning, but unlikely. Much more likely is that the data was not sanity checked before import, and the “diameter” figure here is actually a “circumference”.
In order to work around these issues, when processing the data prior to display I:
Hi community I’m sharing my application to become a Voting Member of HOT through this diary entry.
What does HOT mean to me?
For me, HOT has been a true school since I started mapping in OpenStreetMap. At the end of 2022, as a founding member of the YouthMappers SAGEMA chapter, we were excited to begin using this tool in our research and community work. My first contact was with Juan Melo, Data Quality Senior Associate at the HOT Open Mapping Hub for Latin America and the Caribbean, who became a mentor to our chapter and taught us the tools we needed to organize our first mapathon at the campus of the Universidad Nacional de Colombia. After that experience, I decided to get more involved in volunteer mapping. That’s how I discovered the Tasking Manager and participated in my first humanitarian project: mapping after the earthquake in Morocco. That experience showed me the real impact of OSM, and how with just a little time, we can help save lives. Since then, I have been part of various HOT projects, and each of them has been a constant learning space. HOT has not only been a platform for action, but also a space for training, connection, and personal and collective growth.
Posted by ellieayla_ on 29 May 2025 in English.
In the Halton region in Ontario Canada (and probably elsewhere), many two-way streets split with a boulevard are modelled as two one-way street segments (eg Way 286996210).
It has been observed (2025-May) that many (2025 May, n=244) of these are tagged cycleway=lane, which incorrectly renders in cycling maps as having a bike lane on both sides of the street.
Eg https://www.cyclosm.org/#map=18/43.33590/-79.81317/cyclosm
Many (all?) of these should be tagged cycleway:right=lane instead

Hi everyone,
I’m Paula Villar, from Paraguay with a degree in architecture from the National University of Asunción. I completed my final graduation project as an internship at the Research, Development, and Innovation Center (CIDi) of FADA-UNA, where I participated in open mapping projects, territorial analysis, and the production of geospatial data. I also served as president of YouthMappers UNA (2022–2025), promoting student engagement in collaborative mapping activities.
What does HOT mean to me? HOT represents a community that brings open mapping and geospatial data closer to the people who need them to make informed decisions about their territories. Through projects like Atlas Urbano Paraguay (AUPy) and YouthMappers activities, I’ve seen how collaborative tools and open data help make underrepresented urban and rural realities visible.
I particularly value the spirit of collective work and the opportunity to contribute from different disciplines while learning and sharing with people from diverse backgrounds. Beyond technology, HOT provides a network of support and learning that strengthens territorial management, planning, and responses to local challenges.
How did I get involved in HOT? My introduction to HOT came through my involvement with YouthMappers UNA, where I led mapping activities with students from various fields. That experience, along with my graduation project at CIDi, allowed me to contribute to initiatives like AUPy and other efforts within the YouthMappers network, where open mapping played a central role.
During the internship, I engaged in the production of cartography and territorial analysis for municipalities in both national and cross-border contexts (with Brazil), applying open mapping methodologies and free and open source tools. I coordinated field-mapping campaigns, ran mapping workshops and urban characterizations, and integrated data on buildings, vegetation, and bodies of water.
Hello HOT Membership.
I’m Priscovia Ng’ambi, a passionate OSM Mapper from Zambia, Southern Africa. I’m more than honored to be shortlisted as a 2025 voting member. As a core founder of Local Knowledge Mappers, I serve as Head of Communications and actively contribute to OpenStreetMap as a validator, trainer, and mapper. I also lead the communication for Local knowledge Mappers, a very active open mapping organization in Zambia.
How did you become involved in HOT?
My journey with HOT began in 2020 as a YouthMappers , and at the same time a friend invited me to a mapathon. The very first HOT event I joined, sparked my interest in continue doing my Mapping on TaskManager, it also opened doors to a community that shares my passion for using geospatial technology to drive positive change.
Since then, I have been actively involved in various HOT projects such as disaster Mapping across the global and other events. I’m excited about the opportunity to contribute to the organization’s growth and impact indirectly and directly through mapping.
Coud you tell us about your involvement in HOT, Mapping and/ or Humanitarian response?
As a core founder of Local Knowledge Mappers, I have been very active in promoting OpenStreetMap and geospatial technology in my community. I’ve contributed to various mapping projects, validated data, and trained others on mapping techniques. Through HOT, I have had the opportunity to collaborate with diverse individuals and organizations, working together to create maps that support humanitarian response and sustainable development this is by contributing to mapping on TaskManager, then later on edits created are downloaded to create maps amidst of COVID-19, wars, earthquakes, cyclone etc.
What does HOT mean to you?
Hello, I have completed work in the stilon area of Wilson. I have already moved on and made significant progress in improving Teton Pines, both the golf course and residential areas. I will provide another update once I complete work in this area!
-
Posted by Graeme Herbert on 26 May 2025 in English.
El Gran Apagón
Many people around the world will have heard about the serious power outage that Spain and Portugal had a few weeks ago, as the power grid for almost the whole of the two countries failed for the best part of the day. I know, first world problems for those who live in countries where electricity network failures (or even availability) are still a regular feature of daily life. But the event was still a useful wake-up call on just how dependent we have become on that network for so much of our daily activity, not least because the outage also left people with very limited or non-existent mobile phone and internet coverage.
The blackout happened in the middle of the day when a large part of the adult population was at work, getting home for those whose journey depends on electrified train or underground Metro services turned into a problem for so many. With bus transport and other road transport services overwhelmed by demand the only solution for a lot of people will have been a perhaps unfamiliar walk through a large city like Madrid or Barcelona. And then we get back to the collapse in the mobile telephone network, those mapping services that so many instinctively use for navigation were suddenly just as unavailable as anything else dependent on the internet.

NOTE: I am in the DeFlock discord server. If you see any issues on Flock cameras or similar, or would like a second set of eyes in the Greater Gadsden area, ping me (I’m <@997714796537450597>) in the server, or contact me on any of my available platforms on my profile.
I have added: 1. osm.org/changeset/166784827 2. osm.org/changeset/164790735 3. osm.org/changeset/163818346 4. osm.org/changeset/159052678 So far.
I have noticed someone whether it be human or bot modifying and taking ownership of my points. If this has been noticed, please alert me immediately.

On April 26 and 27, I had the opportunity to share my experiences with YouthMappers Universitas Negeri Jakarta (UNJ) about how to contribute to the Mapillary platform.
for your information, mapilary is very helpful for open mapping activities such as openstreetmap, especially for validating road data because in reality open mappers must use all open sources and mapilary is one of the platforms for that.
in this activity i have provided information and simple techniques on how to collect street level imagery on narrow streets of jakarta using motorbikes and smartphones. YM UNJ has plans to create open mapping activities on openstreetmap and also mapilary.
This Mapillary activity is very helpful for other mappers to map areas that are still not perfectly mapped and do not have street level imagery data for validation.
more info check to this link MapilaryTraining

Recently, someone asked me to create a custom MapCSS style for JOSM that visually indicates how “fresh” OSM objects are—essentially, a way to distinguish recently updated or created objects from older ones at a glance.
Digging into the JOSM MapCSS implementation, especially the eval expression support, I realized this was very doable.
The Basic Idea
The approach is pretty straightforward. Each OSM object has a timestamp field (typically stored as a Unix timestamp). By comparing this timestamp to a reference timestamp (say, representing the current year—2025 in this case), we can calculate how “old” an object is.
So I hardcoded a reference timestamp for 2025, subtracted the OSM timestamp from it, and divided the result by the number of seconds in a year (ignoring leap years for simplicity). This gives us a rough “age” of the object in years.
Posted by Malle_Yeno on 25 May 2025 in English.
I’ve recently been taking on more tagging for wheelchair accessibility in my neighbourhood. It’s been one of those “you don’t see it until you think to look for it” kinds of things. I’m not disabled myself, so I never thought to consider the heights of steps (until I tripped on them.) Now that I look for them, I must freak out other people around me as they see me stare at my foot to see whether a step is ankle high or not.
There were a couple things I came to think about while mapping that I could not seem to find answers for in the wiki. A lot of the time, I just answer the question with the framework of “I’ve seen places do these things, so I will treat them as the standard and anything that falls under that bar is limited or not accessible.” I would be curious for others thoughts on them.
- Do establishments need powered doors to be accessible?
Here in Regina (and a lot of Canada, these were extremely common back in Ontario), doors have buttons that you can press to swing the door open mechanically. They have a wheelchair icon on them most of the time, so they are clearly marked as an accessibility feature.
While common, they are not ubiquitous. In my mapping practice, if a place does not have at least one powered door, I label it as limited wheelchair accessibility at maximum. My logic is that even if a door could be physically be opened manually by a patron in a wheelchair (as in, they can open the door and have enough space on the platform outside to maneuver while doing it – I have seen places where the platform is elevated and small enough that you would fall off trying to do so), they shouldn’t have to do that while the option of powered doors exists.
Posted by Noman Bin Hossain on 24 May 2025 in English.

Successful Open Field Mapping Activity Led by YouthMappers at Eastern University, Bangladesh President Noman Bin Hossain.
On May 16, 2025, YouthMappers at Eastern University, Bangladesh successfully conducted an Open Field Mapping activity using Mapillary, a platform for crowdsourced street-level imagery. The initiative took place in Ashulia Model Town, Savar, and was led by our club president, Noman Bin Hossain.
This field event focused on capturing and uploading street-level imagery to support the enhancement of geospatial dataand promote accessibility of real-world visuals for map editing, disaster response, urban planning, and community development.
📍 Location: Road 6, Block B, Ashulia Model Town, Khagan, Birulia, Savar, Dhaka 📅 Date: May 16, 2025 🛠️ Tool Used: Mapillary 🔗 Captured Imagery: Mapillary
Posted by Archit Rathod on 24 May 2025 in English.
Last updated on 30 May 2025.
Introduction
Hi everyone! I’m Archit Rathod, a Computer Science Master’s student at the University of Illinois Chicago and a passionate open-source contributor. My interests lie at the intersection of geospatial technologies, backend systems, and applied machine learning. Over the years, I’ve built full-stack web platforms, worked on real-time traffic modeling, and contributed to research in social networks and AI ethics.
This summer, I’m thrilled to be a Google Summer of Code 2025 contributor with OpenStreetMap, where I’ll be building a system to make navigation smarter and safer through real-time road closure data. I’m deeply grateful to the OSM community and my mentors for this opportunity, and I’m excited to learn, collaborate, and give back.
Project Description: Temporary Road Closures Database and API
OpenStreetMap provides excellent static map data, but temporary road closures, like construction, accidents, or local events, are often missing or delayed. This project addresses that gap.
I’m developing a centralized platform for real-time road closures. Key features include:
- A geospatial database using PostgreSQL/PostGIS for efficient closure storage and queries.
- A RESTful API using FastAPI, with outputs in OpenLR format for location referencing.
- A web-based UI for users to submit and view closures on a live map.
- A prototype integration with OsmAnd, showcasing how routing can dynamically adapt to avoid closed roads.
The goal is to have a fully working, open-source prototype by the end of the summer that enables OSM apps to respond to temporary disruptions, making navigation more reliable for everyone.
Weekly Progress Report
Coming Soon….
Contact Me
Feel free to reach out — I’d love to connect!
- 📍 Location: Chicago, IL, USA
- 📧 Email: architrathod77@gmail.com
- 🌐 Portfolio: archit-rathod.vercel.app
- 💼 LinkedIn: linkedin.com/in/archit-rathod
- 💻 GitHub: github.com/Archit1706
While editing the next edition of WeeklyOSM, I stumbled upon a fascinating case study that caught my full attention.
A certain team, responding to a certain request, set out to display a mobile device’s geolocation on a map—completely offline, without any network access.
Their initial approach? Crawling OpenStreetMap tile images one by one and storing them locally.
It didn’t take long before they hit a wall: the data size exploded, and keeping the tiles up-to-date turned into a maintenance nightmare. Sensibly, they scrapped that plan.
Next, they evaluated two open-source tools: tileserver-gl (JavaScript) and mbtileserver (Go).
In the end, they opted for mbtileserver, citing Go’s “security” over JavaScript. I still don’t fully grasp that reasoning (somehow, it involves a decision between verifying their own source code and verifying the entire JavaScript interpreter), and I even asked them in the comments section. But for now, let’s accept that as a given and move on.
After choosing mbtileserver, they needed MBTiles files to serve. Eventually, they discovered tilemaker, a tool that converts .osm.pbf files into .mbtiles.
They successfully tested it on a small area. Encouraged, they moved on to larger datasets. Then came the pain.
“…half an hour passes, and we experience a computer freeze as all the RAM runs out.”
Their machine couldn’t handle the memory load. So they requested a beefy VM—256 GB of RAM—and tried again. Still no luck.
That’s when they discovered tilemaker’s --store option, which dumps intermediate stages to disk instead of holding everything in RAM. That tweak made it work.
Creating an offline, custom OSM map has been my white whale for years. So I decided to replicate their setup on my own desktop.
I began with installing mbtileserver. That’s when I hit this cryptic error:
cc1.exe: sorry, unimplemented: 64-bit mode not compiled in
Quick Overview/Summary
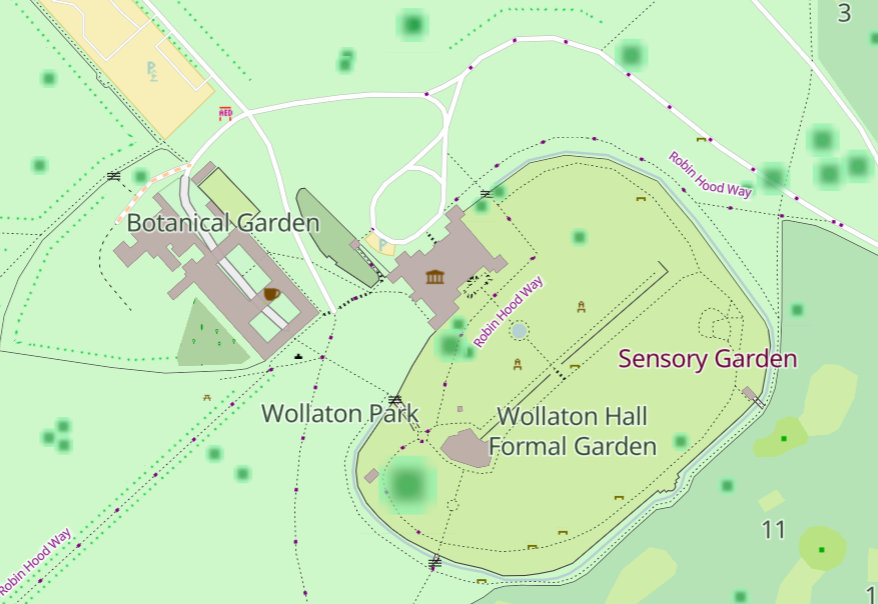
It’s been a year since my last diary entry on this, and I haven’t done too much (I don’t think) in that timeframe. The GIF below should give a good idea of the progress made. Unfortunately, a couple of the changes made in the bottom left corner haven’t been rendered yet.

What’s changed?
I’m still pushing through and adding buildings, or adjusting existing ones. There does seem to be someone else working here every now and then, as I had some of my changes deleted/modified (although I’m not sure of the reason, as the changeset description is not great).
More recently, I have been trying to add in more landuse=* as there is next to none currently. This is still a challenge, though, as so much has changed in 7 years that you’d need an on-the-ground survey or a local to confirm if certain buildings are shops or not.
Plan Going Forward
Posted by KhubsuratInsaan on 23 May 2025 in English.
Last updated on 15 July 2025.

I have a craze for adding addresses to OSM. Unfortunately, in Delhi it is ridiculously hard to find a place with addresses properly displayed on the front. If you come across a house with no nameplate on it, you can be almost sure to not guess the correct house number.
This irks me a lot. So, I have decided to look for guide maps made by the locals while travelling around the city, and use those to map the neighbourhoods. I have got some nice pictures, which I have uploaded to my commons profile.
Here’s one I recently clicked. The amount of detail really supplements my survey a lot.

This diary entry is licensed under CC BY-NC-SA 4.0.