
Hawkeye's Diary
Recent diary entries
![]()
OpenStreetMap Scotland welcomes you,
Join us in Edinburgh between 30 Sep-4 Oct, to explore how people are using OpenStreetMap across the country and beyond.
We have a number of events aimed at different interests groups including community mapping, map developers, international development and map makers:
osm.wiki/State_of_the_Map_Scotland_2015
Please register for Friday, Saturday and Sunday events here (you can select which days you wish to attend):
http://www.eventbrite.co.uk/e/state-of-the-map-scotland-2015-tickets-15981830084
Sign up now to avoid disappointment. Can’t make it? - worry not, the conference will be streamed. Although, you’ll have to be there in person to experience the flying drones or guided tour of the national map library!
Thank you from
OpenStreetMap Scotland
hashtag #sotms15
Sponsors:
Some more cross-stitch to complete but here’s the early view of a globe based on OpenStreetMap data :-)
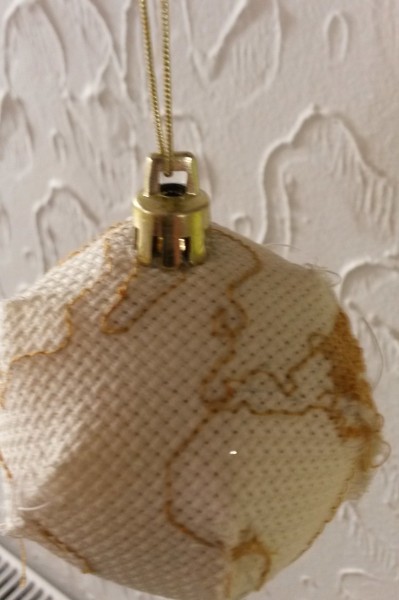
Globes, gores and geojson (topojson)
Been thinking about this for a while. Like maybe two years. How do you make a globe using openstreetmap data? So when I say think, I mean a quick way to hack this together using lots of other peoples hard won code.
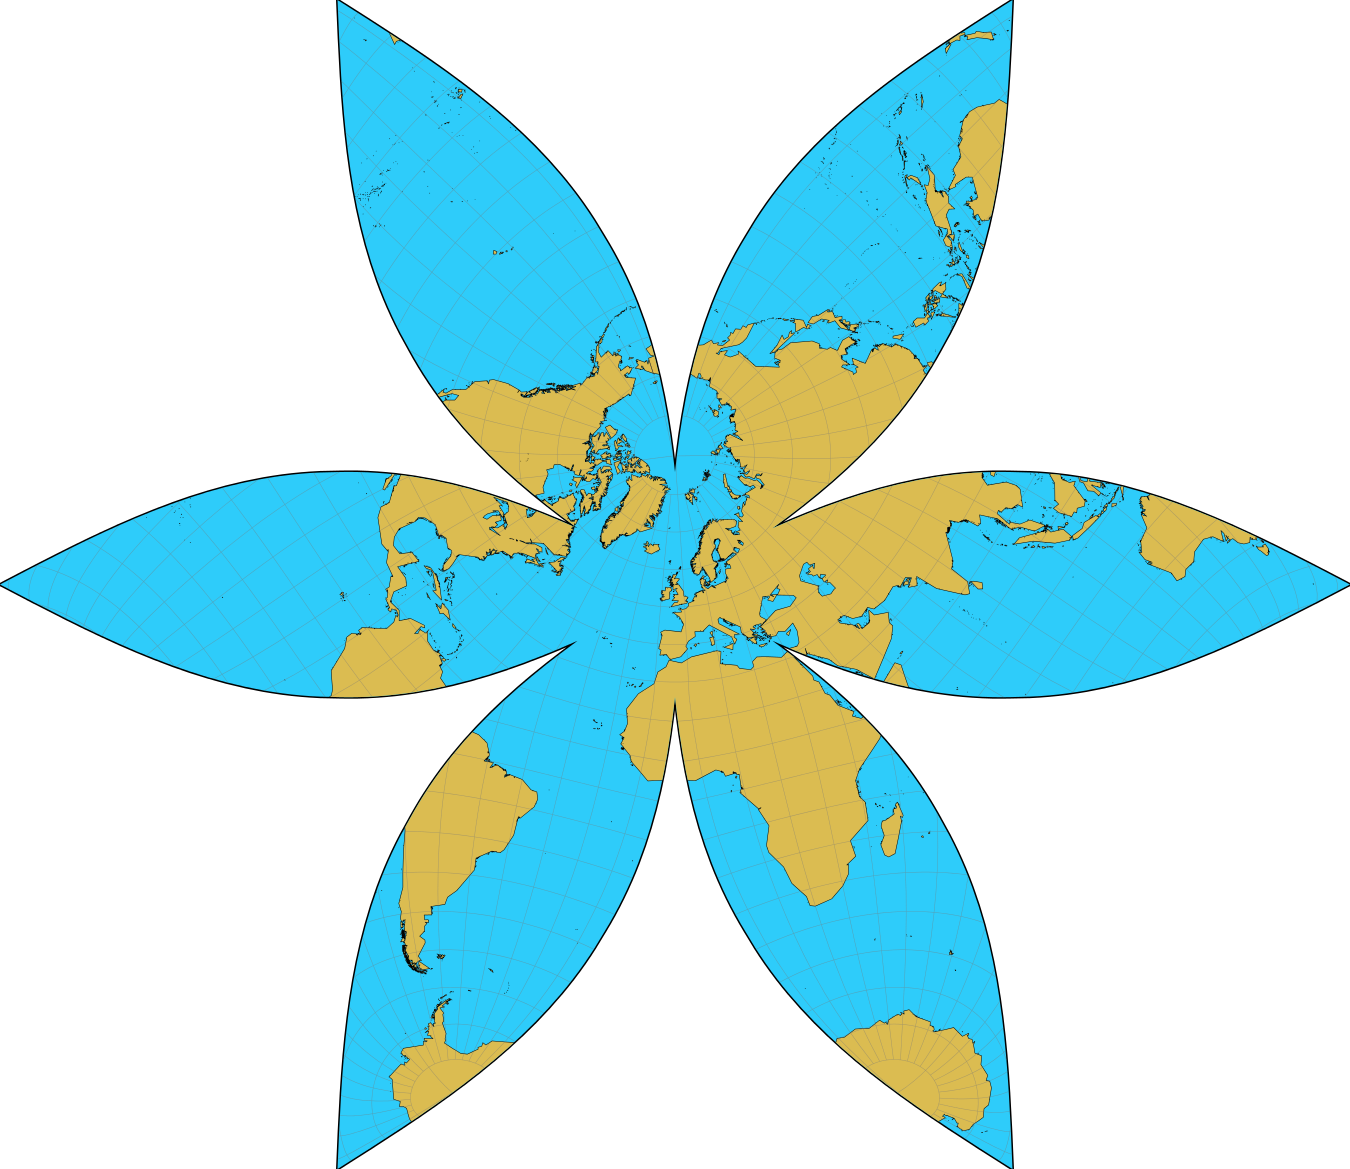
According to what I could find, the main thing was to create ‘gores’ these are the name of the thin oval shapes that make up the outside edge of the classic ‘orange’ segments.
So I googled it a while back and found a perl script for Gimp that appeared to do the trick. At the time, it seemed very involved and I hardly knew much about writing scripts etc (although reading about again - it now seems more straight forward). So I put the idea on the back burner for a while
Making a map of the mappers contributing to mapping parties
Posted by Hawkeye on 29 June 2014 in English. Last updated on 30 June 2014.Mapping parties are great fun and it’s nice to show how much work the people involved put in.
Maybe we should have some type of a map to do this easily? Well, there’s some tools out there already see these questions 1 2.
But these solutions don’t quite cut it, and we want a nice customised map. So let’s use the new date/attic data features in Overpass API. Video explaining them here.
So let’s try it, stick this in your web browser:
overpass-api.de/api/interpreter?data=[diff:"2014-06-23T00:00:00Z"];node(55.877838662652906,-4.343075752258301,55.900317043029,-4.297800064086914);out meta;
This gets all the changes made to nodes in that bounding box between 23/06/2014 to the present time. The query returns osm xml file. So just add ‘.osm’ to the end of the file and load this into JOSM or QGIS and were ready to go, right? Nope, the file isn’t a standard .osm file. I couldn’t get it to load in JOSM or QGIS. So no problem. Let’s convert to GeoJSON. Okay, there’s a few ways to do this. OGR2OGR is a command line tool and there’s a few javascript osm to geojson libraries. Great, now we a rocking. Ah, hang on one sec. I found it difficult to make these tools retain the ‘meta’ data - e.g. the userID and name of the user who last modified the feature. And we want the meta data so we can credit people who have made the edits not just show where the edits were made.
I found this tool was easy to download and gave the option for meta data:
http://tyrasd.github.io/osmtogeojson/
Install this at command line:
$ npm install -g osmtogeojson
and try something like:
$ osmtogeojson Anniesland.osm > Anniesland.geojson --flatProperties
Brilliant. We can now stick the .geojson in QGIS or Tilemill and make a map:
Can’t help thinking John Muir, the eminent 19th Century (Scottish-American) naturalist would have been a huge fan of OpenStreetMap. He was a bit of a hacker/maker in his day and his love of a good wander (up to a 1000 miles or more) would have made him a handy mapper.
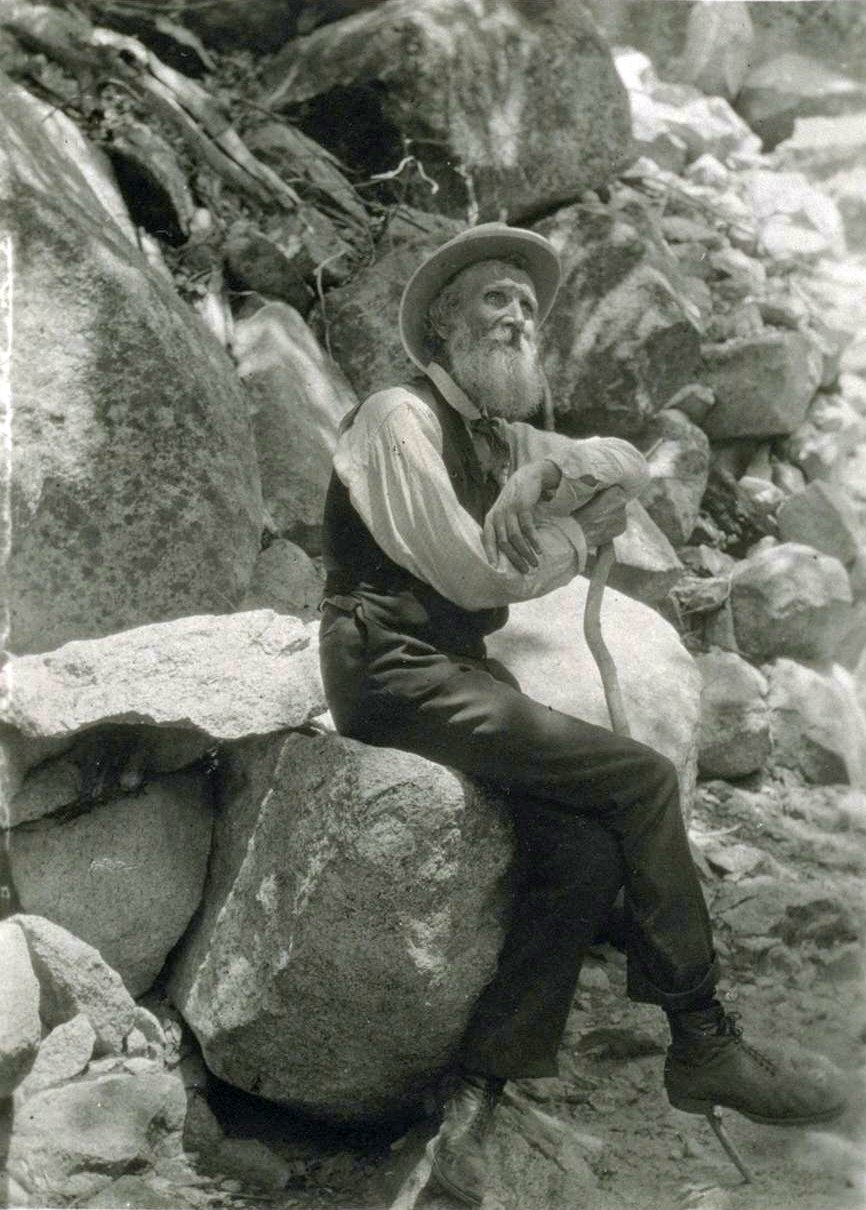
Anyway, the John Muir Way has recently been officially opened for hiking and cycling across the central belt of Scotland. It a coast to coast route (with slightly different routes if you are cycling or on foot).
There’s still a little bit of work required on mapping the hiking route. But the bicycle route is one continuous section. You can view the route and get some analysis of it here. What a neat tool that is, Kudos to GrundID.
But how do you work out how many people have contributed to mapping this? All the ways, nodes etc?
OpenStreetMap - Increasing diversity
Posted by Hawkeye on 9 February 2014 in English. Last updated on 10 February 2014.After hearing this keynote about diversity and gender at SOTM 13 and previously this video. I thought it would be good to look for ways to broaden our community through the events I help to organise in Scotland. In general, I think we are reasonably successful at attracting a wide range of people and it’s worth noting that OpenStreetMap may achieve the best success when it works with existing groups and partners during mapping parties. Some thoughts of participation at mapping parties here. But we can definitely do better.
So I’m following Wikipedia’s lead and hoping to work with Glasgow Women’s Library to run a community mapping party event some time later this year as one way to make sure the widest and richest set of features are uploaded to OSM and offer a better alternative to inherent bias in other maps.
While organising this event, I was asked this question: ‘Tell us about your experience of working with women and diverse communities and how you will ensure this project respects difference and safeguards equalities?’
Good question. Which got me thinking - does OpenStreetMap have a policy safeguarding equality or respecting difference. Well, short answer is no.
The mission statement includes ‘open to all’ and ‘democratic process’ but doesn’t specifically refer to supporting or promoting diversity or equality. Nor do the draft core values
In contrast Wikimedia values includes this section:
‘Our board of trustees, staff members, and volunteers are involved without discrimination based on their religion, political beliefs, sexual preferences, nationalities, etc… Not only do we accept diversity, but we actually look forward to it’
Wikimedia even had a conference about diversity.
So how do we share the mapping love with the broadest range of people?
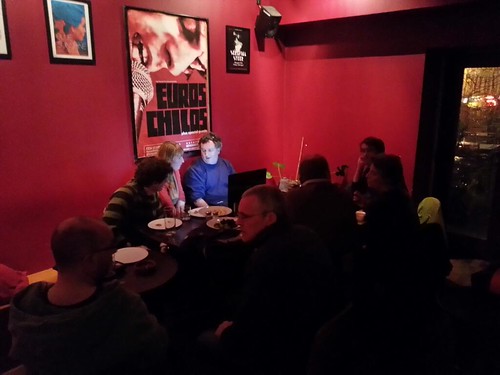
Meetup Blog - Tu 19 Nov - Saramago bar, CCA, Glasgow
Lots to discuss (more than usual?) at the this quarterly meetup in Glasgow. Following on from an Open Knowledge Foundation event in the same venue the night before, there was a large cross over of people wanting to join us to discuss the spatial side of open knowledge.
Big part of the night was spent discussing plans for a State of the Map Scotland event for next year - possibly early in the year - Spring/Summer. This time we are keen to bring SOTM Scotland back to Glasgow (where it started 3 years ago). Partly because Glasgow is convenient for yours truly, but perhaps more interestingly it’s also the winner of a Future Cities Demonstrator prize. The prize is to help Glasgow innovate around smart city ideas and open data to make a better city. So we are hoping to tap into the activity around smart cities & open data in collaboration with wikimedia, libraries and open knowledge foundation to create a really great event.
You like cake? You like a challenge?
Grab a slice of the 100 square mile mapcake of the Black Isle - North Scotland. Please spend a few minutes editing here - much appreciate and will help support sustainable transport. Thank you!
![Black Isle mapcake] (http://farm8.staticflickr.com/7307/9667485370_10643d7988.jpg)
This will really help the Black Isle mapping party which is being held on 7 Sept organised by Transition Black Isle.
Hey,
Want to know more about making maps of your community, citizen science, open data, and how to get started? All welcome to join the Glasgow OpenStreetMap social meetup at the Saramago bar in the Centre for Contemporary Arts, Sauciehall Street. Tuesday 20 Aug 7pm.
We meet here on the third Tuesday, every 3 months.
You’ll find us in the bar, look out for a hi-viz jacket and maybe some laptops. Excellent vegetarian food available and good selection of beer and soft drinks.
There will be people to help with any OpenStreetMap questions about editing and using data. Will also be talking about:
Cycle route stats
In an effort to calculate some cycle route stats in Scotland for this weekend’s cycling protest called Pedal on Parliament, I created a cycle stats website.
It uses an R script to download the latest data from fabulous Geofabrik, it then cookie cuts .osm Scotland into MSP constituencies. The boundary data is from OS Open Data (simplified and processed into polylines in QGIS). The .osm data is converted into data.frames and analysed using osmar library for cycle route relations and ways.
There are more than a few assumptions and hacks in the process and some unexpected results.
Basically, I think I’m asking a bit too much of the osmar library and I need to try a database approach. But it works - kind of.
From the early days of helping with OSM, I’ve been interested in being able to summarise in some basic way the geographical features in my area. Whether it’s the number of bus stops or if there are more car parks than parks? Following the recent Dunbar mapping party, i started to investigate the options for this type of analysis.
Dunbar mapping party:
Previously, I used QGIS for this type of task and to create maps. This is a great tool for visualising but like Excel for spreadsheets it is difficult to reproduce and reapply analysis to different areas. To improve flexibility and quickly reproduce work on different areas requires a database and scripting. A geodatabase can be linked to QGIS but I faced problems with keeping the database up to date. Scripting can also be done in QGIS via a python command line and GRASS plugin. Certainly python has a lots of powerful features here is a video discussing some of them and I’d like to try this more in the future.
Hi,
I started a Dunbar map cake prior to on the ground mapping party next week:
Click here for your slice of the pie!
Please dive in - just 5mins would be great. Trace some buildings.
Thank you
Tim
More about Dunbar mapping party here

Dear OpenStreetMap mapper: We are the small non-profit that runs the #6741 website in the world (#1,824 in Germany). We don’t have any staff but serve 1 billion map tiles every eleven days, and have costs like any other top site: dragons, power, rent, programs, trolls and legal help. OpenStreetMap is something special. It is like a sensory garden or a learning circle. It is like a temple for cartographers. It is a place we can all go to map and navigate our way through life. To protect our independence, we’ll never run ads. We take no prisoners. We run on donations averaging about £30. If everyone reading this gave the price of a cheap tourist map, our fundraiser would be done within an hour. If OpenStreetMap is useful to you, take one minute to keep it online another year. Please help us forget fundraising and get back to mapping. Thank you.
Please help - I'm addicted to OpenStreetMap and couldn't map without it