
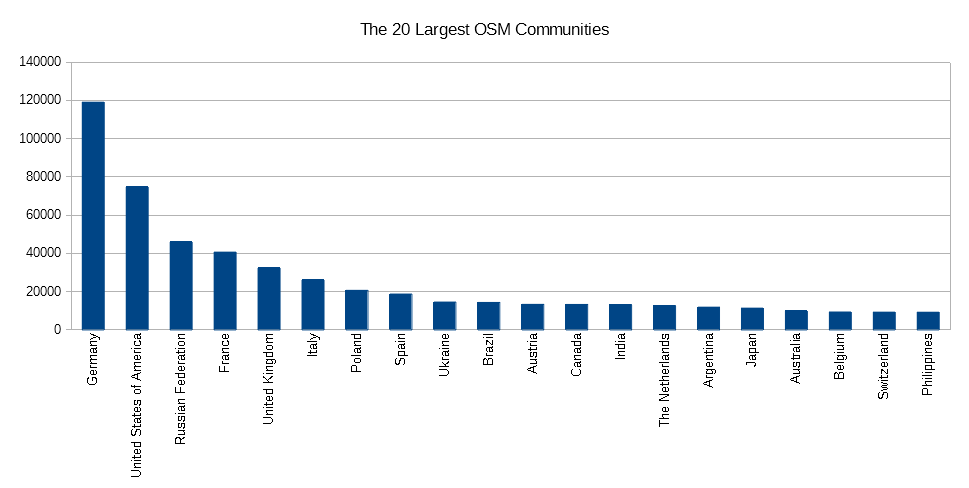
I’ve just updated the contributor statistics for the whole year 2018.
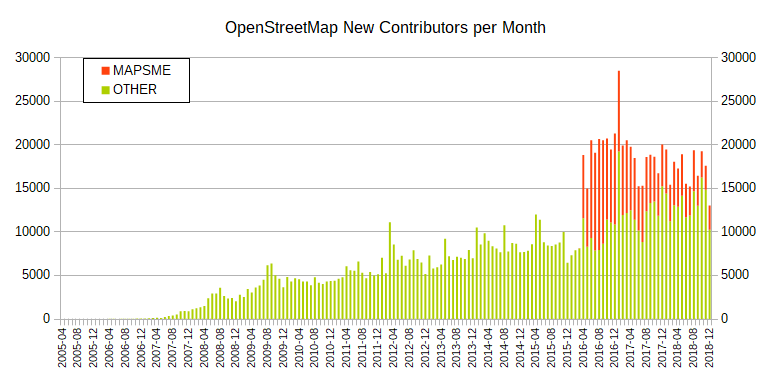
As I pointed out here 2017 update blog post some the graphs look a bit odd due to the one-time effect of an initial large number maps.me users contributing as the editing feature was introduced.
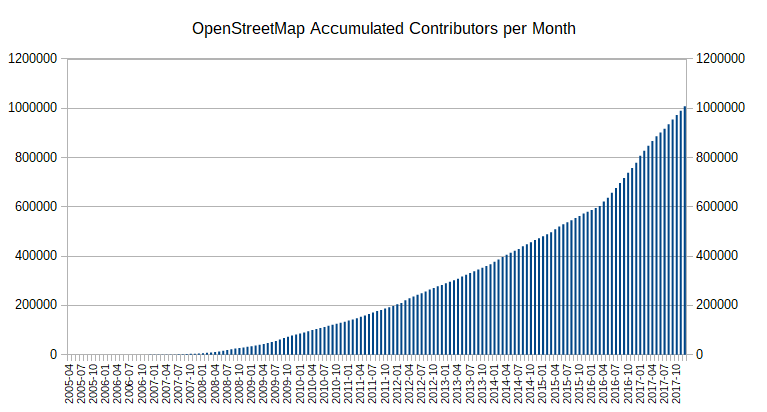
This effect continued to decrease during 2018, but for completeness sake here are the updated graphs from the blog post for 2017 that continue to show continuing growth even without maps.me.
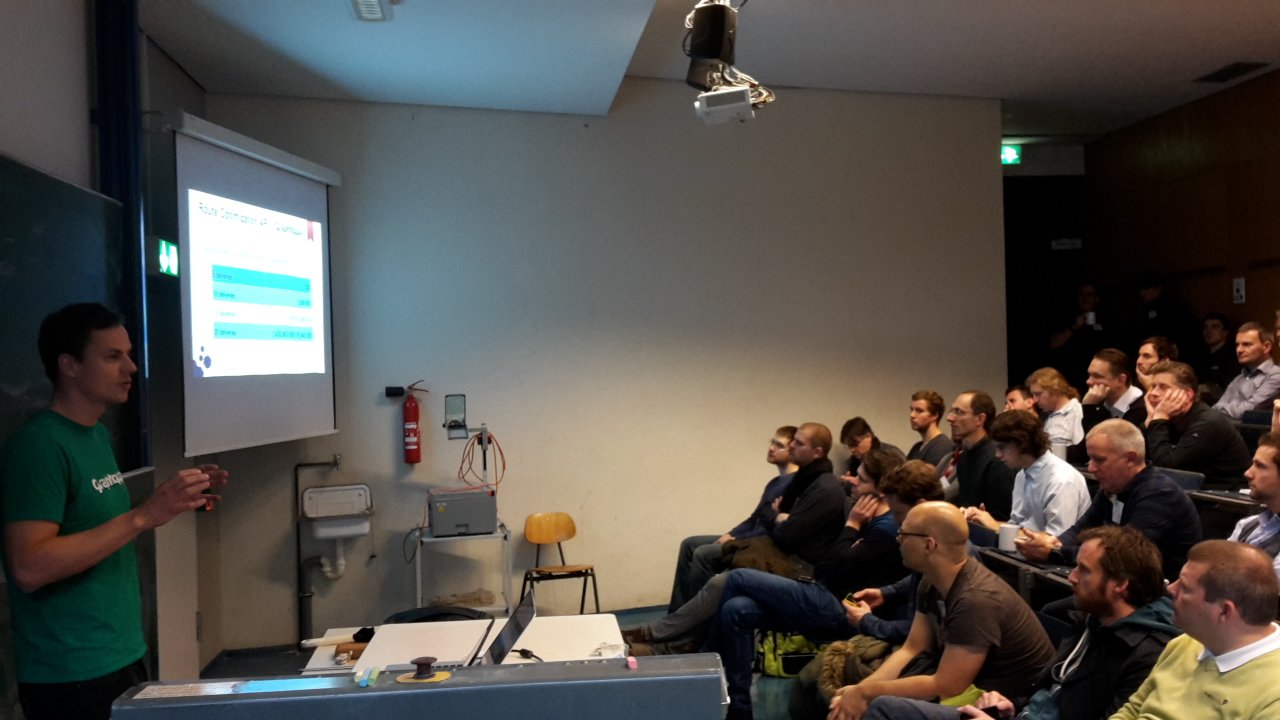 Stefan from GraphHopper presenting at Wherecamp Berlin.