OpenStreetMap logo OpenStreetMap

ZeLonewolf's Diary

Recent diary entries

The Creative Commons Zero (CC0) waiver is, in my opinion, the most free way to release open-source software. Unlike licenses that impose conditions on the use, modification, or distribution of software, CC0 allows me to waive all my rights to limit what users can do with the software. It effectively places the work in the public domain. This absolute waiver ensures that the software can be freely used by anyone, for any purpose, in any way. Here’s why I choose CC0 when releasing open source software and why I cannot – and will not – grant permission to use my CC0 software.

Software freedom

Other licenses impose various requirements on using software, such as:

  • Copyleft/viral licensing: Mandates that derivative works also be open-source and follow the same licensing conditions.
  • Attribution requirements: Requires giving credit to the original authors in all copies or substantial portions of the software.
  • Redistribution conditions: Imposes specific terms on how the software can be redistributed, including the requirement to state changes made to the code.
  • Source code disclosure: Requires making the source code available to anyone who receives a copy of the software.
  • License compatibility issues: Restrictions that affect the ability to combine the licensed software with other code under different licenses.

In contrast, CC0:

  • Imposes no obligations for attribution.
  • Requires no disclosure of source code.
  • Does not mandate any specific licensing for derivative works.
  • Places no restrictions on combining CC0-waivered software with other code.

This complete freedom fosters innovation, as developers can build upon CC0-waiver software without worrying about legal ramifications or compatibility issues with other licenses.

That means:

  • Hobbyists can use it.
  • Companies that make money can use it.
  • People I don’t like can use it.

See full entry

Distribution of primary populated place values

Posted by ZeLonewolf on 30 April 2024 in English. Last updated on 2 May 2024.

There is a long discussion happening in the United States section of the community forum regarding where to draw the line between the “main” populated place node values, and specifically the place=* values of city and town in New England. I thought it would be useful to do a bit of analysis to see how these values are distributed across the database when compared to population. Through this analysis, I include all tags which have place values of city, town, village, hamlet, and isolated_dwelling. I also only include nodes that have a population tag.

My overpass query for each category looks like this:

[out:csv(::id,place,population;true;"|")][timeout:60];
node[place=city][population];
out;

One of the challenges of analyzing this key is that because it represents order-of-magnitude differences, its distribution is log-normal. In other words, it forms a bell curve provided that the X-axis is drawn logarithmically.

To look at this data logarithmically, I grouped the place nodes logarithmically, in steps of 1, 2, and 5 per 10x jump. When viewing the distribution of place=town, the log-normal shape comes out quite clearly. The number on the X axis represents the upper limit of each bin.

See full entry

Surveying the country, one street at a time, with StreetFerret

Posted by ZeLonewolf on 2 March 2024 in English. Last updated on 4 March 2024.

I operate StreetFerret, a site that shows runners, walkers, and cyclists which streets they’ve visited in a city or town. StreetFerret works by taking a user’s Strava activity data, and comparing it to OpenStreetMap map data to decide which streets they’ve completed.

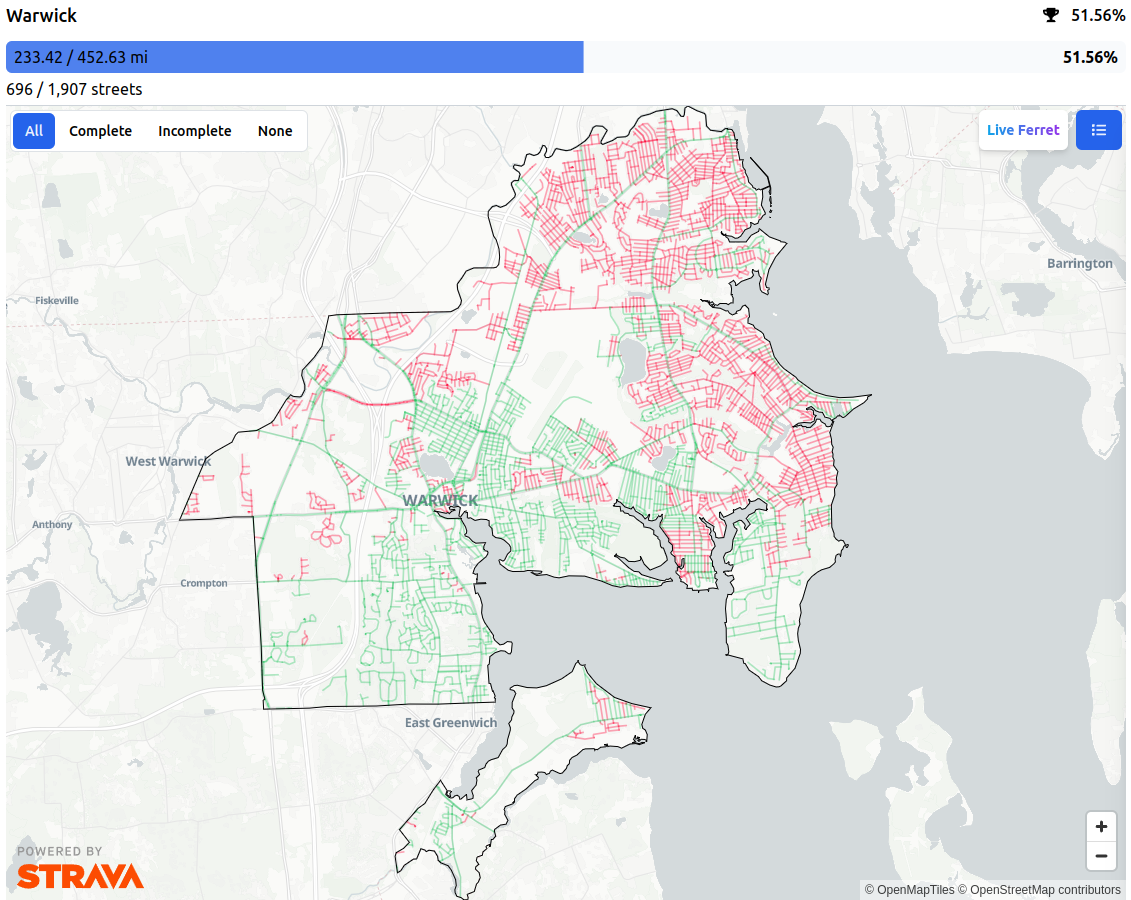
For example, this is my StreetFerret map of Warwick, Rhode Island (USA):

StreetFerret map of Warwick, RI

OpenStreetMap is an awesome partner for StreetFerret because as the map gets updated, StreetFerret can update its street data too, within about a week. For someone trying to run, walk, or bike every street in their city, they don’t want to get their map to 99%, they want to get it to 100%! So, when they encounter a street that’s wrong in StreetFerret, they are motivated to edit OSM, which makes StreetFerret AND OpenStreetMap better at the same time. StreetFerret users have corrected OSM data countless times in pursuit of 100% completion.

See full entry

Location: Yucaipa, San Bernardino County, California, 92399, United States

In my last diary entry, I described how I hosted the tile.ourmap.us planet vector tileserver for the OSM Americana project using Amazon Web Services (AWS). This approach is good, but it costs more than necessary and is expensive if you want the tiles to update continuously!

While I was at State of the Map US in Richmond, VA this summer, I ran into Brandon Liu, the creator of protomaps and more importantly, the PMTiles file format. PMTiles provides several advantages over mbtiles which allow us to create an ultra low-cost setup. He shared with me the key elements of this recipe, and I highly recommend his guides for building and hosting tile servers.

With this setup, I am able to run tile.ourmap.us for $1.61 per month, with full-planet updates every 9 hours.

Eliminating things that cost money

The first thing that cost money is running a cloud rendering server. I would spin up a very hefty server with at least 96Gb ram and 64 CPUs, which could render a planet in about a half hour. However, thanks to improvements in planetiler, we can now run planet builds on hardware with less ram (provided there is free disk space), at the expense of the builds taking longer.

I happened to have a Dell Inspiron 5593 laptop lying around that I wasn’t using, because it had a hardware defect where several keys on the keyboard stopped working, even after a keyboard replacement. It had decent specs - an 8-core processor (Intel(R) Core(TM) i7-1065G7), 64Gb of ram, and a 500Gb SSD hard drive. Rather than let it continue to collected dust, I plugged in a keyboard and installed Ubuntu so it could be my new render server.

See full entry

Thanks to planetiler, it is possible to run your own OpenMapTiles vector tile server on Amazon Web Services (AWS) for less than $20 per month. This guide describes the process that I used to stand up tile.ourmap.us for the OSM Americana project, and it does require some knowledge of AWS. However, I taught myself how to use AWS, and I’ve tried to include enough details here to assist someone trying to stand up their own tileserver.

There are many different ways to do this, including different storage, hosting, and tileserver setups. This is just one option that worked for me for what I was trying to do.

The architecture

This setup in this guide assumes that infrequent planet updates is acceptable for your use case. So, we will spin up a powerful server to update the map only when needed, and use a low-powered server to run the HTTPS tile server on an ongoing basis. If you require more frequent map updates, this is probably not a good solution and you should consider dedicated hardware. The main advantage of AWS in this use case is the ability to rent a high-performance computer for a short period of time.

Additionally, this setup assumes that you already own a domain name that you can use to point to the tile server. If you don’t have one, you can purchase one on Google Domains for $12 per year.

In our setup, we will render a planet to a large file in .mbtiles format, and use tileserver-gl to serve that .mbtiles as an HTTPS server.

Another advantage of using AWS is that they host a locally-mirrored copy of the planet file. Therefore, it is posible to download the planet in a few minutes, which reduces the amount of time that we have to rent that high-powered server to render the planet.

When we say “render the planet,” it means the following operation:

See full entry

OpenMapTiles planet-scale vector tile debugging at low zoom

Posted by ZeLonewolf on 10 January 2023 in English. Last updated on 11 January 2023.

The Americana vector style uses OpenMapTiles as its backing data schema. When the project desires to add a new feature that isn’t available in OpenMapTiles, someone from the team typically submits a PR to add it. Eventually, OpenMapTiles will create a release, which gets picked up by the Planetiler OpenMapTiles profile, after which I would re-render the planet on an AWS instance. This process from end-to-end often takes months before we see the results at planet scale.

Because planetiler’s update cycle follows OpenMapTiles, contributors need to use the older openmaptiles-tools, which can take days, weeks, or even months to render a planet, depending on how powerful the developer’s computer is.

Therefore, when testing a change to OpenMapTiles, a contributor would typically test their changes on a small area, with a command like:

./quickstart.sh rhode-island

This command would download a PBF extract from Geofabrik, and run a series of scripts that ultimately produce an .mbtiles file of Rhode Island. If you’re testing a feature that appears at high zoom, you can edit .env and change the setting to render down to the maximum zoom of 14. Because Rhode Island is so small, a full-depth render only takes a few minutes.

However, what if you are testing a low zoom feature like an ocean or sea label? If you need to test whether the Atlantic Ocean label is rendering properly, there is no extract short of the planet that will contain an ocean.

The solution for developers working with these features is to download the planet file, and then pre-filter it using the tags-filter feature in osmium tool for just the features that you care about testing at low zoom, and then render that into tiles.

First, you download the planet pbf file:

AREA=planet make download

This will download a file planet.osm.pbf into the data/ folder.

See full entry

Location: 61.418, 20.566