OpenStreetMap logo OpenStreetMap

rphyrin's Diary

Recent diary entries

LastUpdated v1.9_2025-06-08

Posted by rphyrin on 8 June 2025 in English. Last updated on 10 June 2025.

Recently, I needed to open my OpenStreetMap profile—just to right-click and save my own profile picture for use on another platform.

Thanks to the newly redesigned OSM profile layout, I was greeted by a few new statistics—one of which showed how many comments my last diary post had received. While I was busy grabbing my avatar, I couldn’t help but notice that my recent diary post had garnered quite a bit of discussion.

To my surprise, at least two commenters pointed out the same thing : they suggested it would be more intuitive if the value reflected actual months, rather than “something that roughly represents the progress of the year in base-10.”

That got me thinking—how hard would it be to convert that base-10 year-progress value into something closer to a conventional month (base-12)?


Step 1: Extract the Year

To compute the year from an OSM timestamp (Unix time), we start by offsetting it from a known reference point—specifically, the Unix timestamp for the start of the year 2000.

(osm_timestamp - 946692127) / 31556952
  • 946692127 is the Unix timestamp for Sat Jan 01 2000 02:02:07 GMT+0000. This value was arbitrarily chosen by me (high accuracy isn’t necessary; I just needed a reference point roughly around the year 2000).
  • 31556952 is the average number of seconds in a year (365.2425 days).

This gives us a floating-point number: the integer part is the year offset from 2000.

To extract the integer part (representing the year), we can substring the first 2 character:

substring(divided_by(osm_timestamp - 946692127, 31556952), 0, 2)

Oh wait!

While writing this post, I stumbled upon a small but interesting bug from the initial release.

Originally, the code extracted the first three characters of the computed year value. This worked fine for double-digit years like 2010 and beyond—10.5 would yield “10.”, which was sufficient for identifying the year and using the decimal as a makeshift separator between year and month.

See full entry

Recently, someone asked me to create a custom MapCSS style for JOSM that visually indicates how “fresh” OSM objects are—essentially, a way to distinguish recently updated or created objects from older ones at a glance.

Digging into the JOSM MapCSS implementation, especially the eval expression support, I realized this was very doable.

The Basic Idea

The approach is pretty straightforward. Each OSM object has a timestamp field (typically stored as a Unix timestamp). By comparing this timestamp to a reference timestamp (say, representing the current year—2025 in this case), we can calculate how “old” an object is.

So I hardcoded a reference timestamp for 2025, subtracted the OSM timestamp from it, and divided the result by the number of seconds in a year (ignoring leap years for simplicity). This gives us a rough “age” of the object in years.

See full entry

While editing the next edition of WeeklyOSM, I stumbled upon a fascinating case study that caught my full attention.

A certain team, responding to a certain request, set out to display a mobile device’s geolocation on a map—completely offline, without any network access.


Their initial approach? Crawling OpenStreetMap tile images one by one and storing them locally.

It didn’t take long before they hit a wall: the data size exploded, and keeping the tiles up-to-date turned into a maintenance nightmare. Sensibly, they scrapped that plan.


Next, they evaluated two open-source tools: tileserver-gl (JavaScript) and mbtileserver (Go).

In the end, they opted for mbtileserver, citing Go’s “security” over JavaScript. I still don’t fully grasp that reasoning (somehow, it involves a decision between verifying their own source code and verifying the entire JavaScript interpreter), and I even asked them in the comments section. But for now, let’s accept that as a given and move on.

After choosing mbtileserver, they needed MBTiles files to serve. Eventually, they discovered tilemaker, a tool that converts .osm.pbf files into .mbtiles.

They successfully tested it on a small area. Encouraged, they moved on to larger datasets. Then came the pain.

“…half an hour passes, and we experience a computer freeze as all the RAM runs out.”

Their machine couldn’t handle the memory load. So they requested a beefy VM—256 GB of RAM—and tried again. Still no luck.

That’s when they discovered tilemaker’s --store option, which dumps intermediate stages to disk instead of holding everything in RAM. That tweak made it work.


Creating an offline, custom OSM map has been my white whale for years. So I decided to replicate their setup on my own desktop.

I began with installing mbtileserver. That’s when I hit this cryptic error:

cc1.exe: sorry, unimplemented: 64-bit mode not compiled in

See full entry

Who's the Most Active Mapper in City X?

Posted by rphyrin on 20 May 2025 in English. Last updated on 23 May 2025.

So, I got invited to speak at a certain OSM community’s monthly online talk.

Nice, right?

Well, there’s just one problem: I have absolutely no idea what to talk about.

Sure, I could present one of my recent OSM-related programming projects, or share updates on what I’ve been mapping over the past few weeks. Maybe even talk about my personal hopes and dreams for the OpenStreetMap movement—or write a more reflective essay on the movement’s progress and future.

The deadline is still a ways off, so while I mull over the best topic, I figured I’d start with something simple. Something fresh. Something that literally popped into my head minutes before writing this post.

It all starts with a very basic question:

“Who is the most active mapper in city X?”


Why This Question Matters

If answered properly, this question could open the door to a whole series of follow-ups:

  • Are they local, organic contributors—not affiliated with a distant organized mapping group but actual residents who have lived in the city for a long time?
  • What does their OSM diary look like?
  • What have they been mapping lately?
  • Are they part of a local mapping group?
  • Have they initiated any projects in the past—or are they running one now?
  • Can we collaborate with them? Reach out?

Active mappers are often the “local ambassadors” of OSM. They can be our primary point of contact for a specific area—people who know the region inside out. They might even offer local tips, points of interest, or become a valuable reference for others mapping or traveling to the same area. Sometimes, these mappers even maintain detailed wiki pages for their city—outlining points of interest, transit routes, historical context, recent updates, or even personal anecdotes.


Meet Your Mappers

See full entry

Transjabodetabek B41

Posted by rphyrin on 18 May 2025 in English.

Although I read the newspaper (almost) every day, lately I’ve been getting news faster through my social circle. It usually starts as a rumor from an online friend, popping up on my timeline :

“There’s a new bus route coming to town!”

“Look at this photo I took— they’re testing the route!”

“I tried the trial run. Here’s a draft of the route I recorded myself.”

That’s what I’d been hearing for the past few weeks.

And then, finally, that rumors showed up in the daily newspaper I read.

See full entry

My First JOSM Validation

Posted by rphyrin on 17 May 2025 in English.

May 16, 2025 (22.46 PM) : “Before starting validation on Project 18915, would you mind assisting with validation on another project first? It would be helpful for practice on a few tasks/grids beforehand.”


Since this is my very first validation project, I thought it would be best to train myself beforehand.

To start, I needed to choose a project to validate. I preferred a recent and active one, so I decided on Project #20468, which was created in response to the recent earthquake in Myanmar. The objective of this mapping project is to identify clusters of residential areas to support better disaster mitigation efforts in the future. Individual buildings do not need to be mapped—only clusters of houses (more than five) using landuse=residential.


The first issue I encountered after clicking the “Validate” button was that JOSM needed to be open with “Remote Control” enabled.

So, I opened JOSM, navigated to Edit → Preferences → Remote Control, and enabled the option. Once that was done, the task loaded successfully from my browser into JOSM. That was a pleasant surprise—I hadn’t known JOSM had this feature.


Next issue: my favorite keyboard shortcuts from the iD editor didn’t work in JOSM. I figured the keys might be different, and wondered whether someone had already created a shortcut conversion table between iD and JOSM.

Eventually, I found the relevant information.

At the moment, I don’t need many shortcuts—just a few essentials. The wireframe toggle is particularly important since it helps me cross-check OSM data against the underlying satellite imagery. Additionally, I often want to inspect specific OSM objects; I’ve already prepared several Violentmonkey scripts (such as BetterOSM and OSMHelper) to satisfy my curiosity. For that, I need to open the original URL of an OSM object in the browser.

See full entry

OpenStreetMap Indonesia, in partnership with TomTom, organised a Community Mapping Party at GoWork Plaza Indonesia in Jakarta on Saturday, 26 April 2025.


Planning

January 23, 2025 – 17:05 WIB

“For those living in the Jabotabek area, how about we hold our first offline monthly talk next time and align it with the TomTom Mapping Party event?”

Initial discussions about hosting an offline gathering began among members in the Greater Jakarta area. A suggestion was made to align the monthly community meeting (usually held online, but in this proposal, it will be held offline for the first time) with an upcoming Mapping Party event organized by TomTom. The idea was presented in an open-ended way, inviting members to consider the possibility when time allowed.

January 30, 2025 – 08:34 WIB

“It might be better to hold it before Ramadan.”

The conversation picked up pace, with another participant suggesting that it would be preferable to hold the event before the fasting month (Ramadan) began. The comment hinted at the logistical advantages of scheduling it earlier.

February 3, 2025 – 11:01 WIB

“If it is held before Ramadan, preparation time would be very tight. It has been proposed to schedule it after Eid, possibly in mid or late April, and a response is still awaited.”

It was mentioned that holding the event before Ramadan might be too rushed given the short preparation time. As a result, a new proposal was introduced: to hold the Mapping Party after the Eid al-Fitr holiday, possibly in mid to late April. Final confirmation was still pending at that point.

March 23, 2025 – 14:28 WIB

“If we hold an offline mapping party and meetup at the end of April 2025 somewhere around Jabodetabek, would participants be able to attend?”

See full entry

Verschiedene Auszüge

Posted by rphyrin on 11 April 2025 in English. Last updated on 13 April 2025.

“Before 2011, if you asked most cartography professionals, they’d say OpenStreetMap was a toy. The turning point for me was a photo of a firefighter from a search and rescue team using a handheld GPS device—they used OSM maps to coordinate efforts after the Haiti earthquake.”

“During natural disasters like Haiti in 2011, nearby countries send search and rescue teams, and organizations like Doctors Without Borders and the Red Cross deploy. They requested a map to set up a field hospital. The Haitian government was basically like, “What? How?” So you go to Google Maps, right? Like anyone would. But there was nothing—Haiti had no commercial map coverage at the time. Even if there had been, it was likely destroyed. Then we showed up—just four OSM geeks—because nobody else cared about geographic data. With the help of 500 volunteers with iPhones, we mapped the entire street network of Port-au-Prince in a week. That map allowed NGOs to move through the city and save lives. It was a turning point—after that, the World Health Organization started listening to us.”

Flyers (April 3, 2025) “Expertos en cartografía: OpenStreetMap es la Wikipedia de los mapas” Medio Multimedia


See full entry

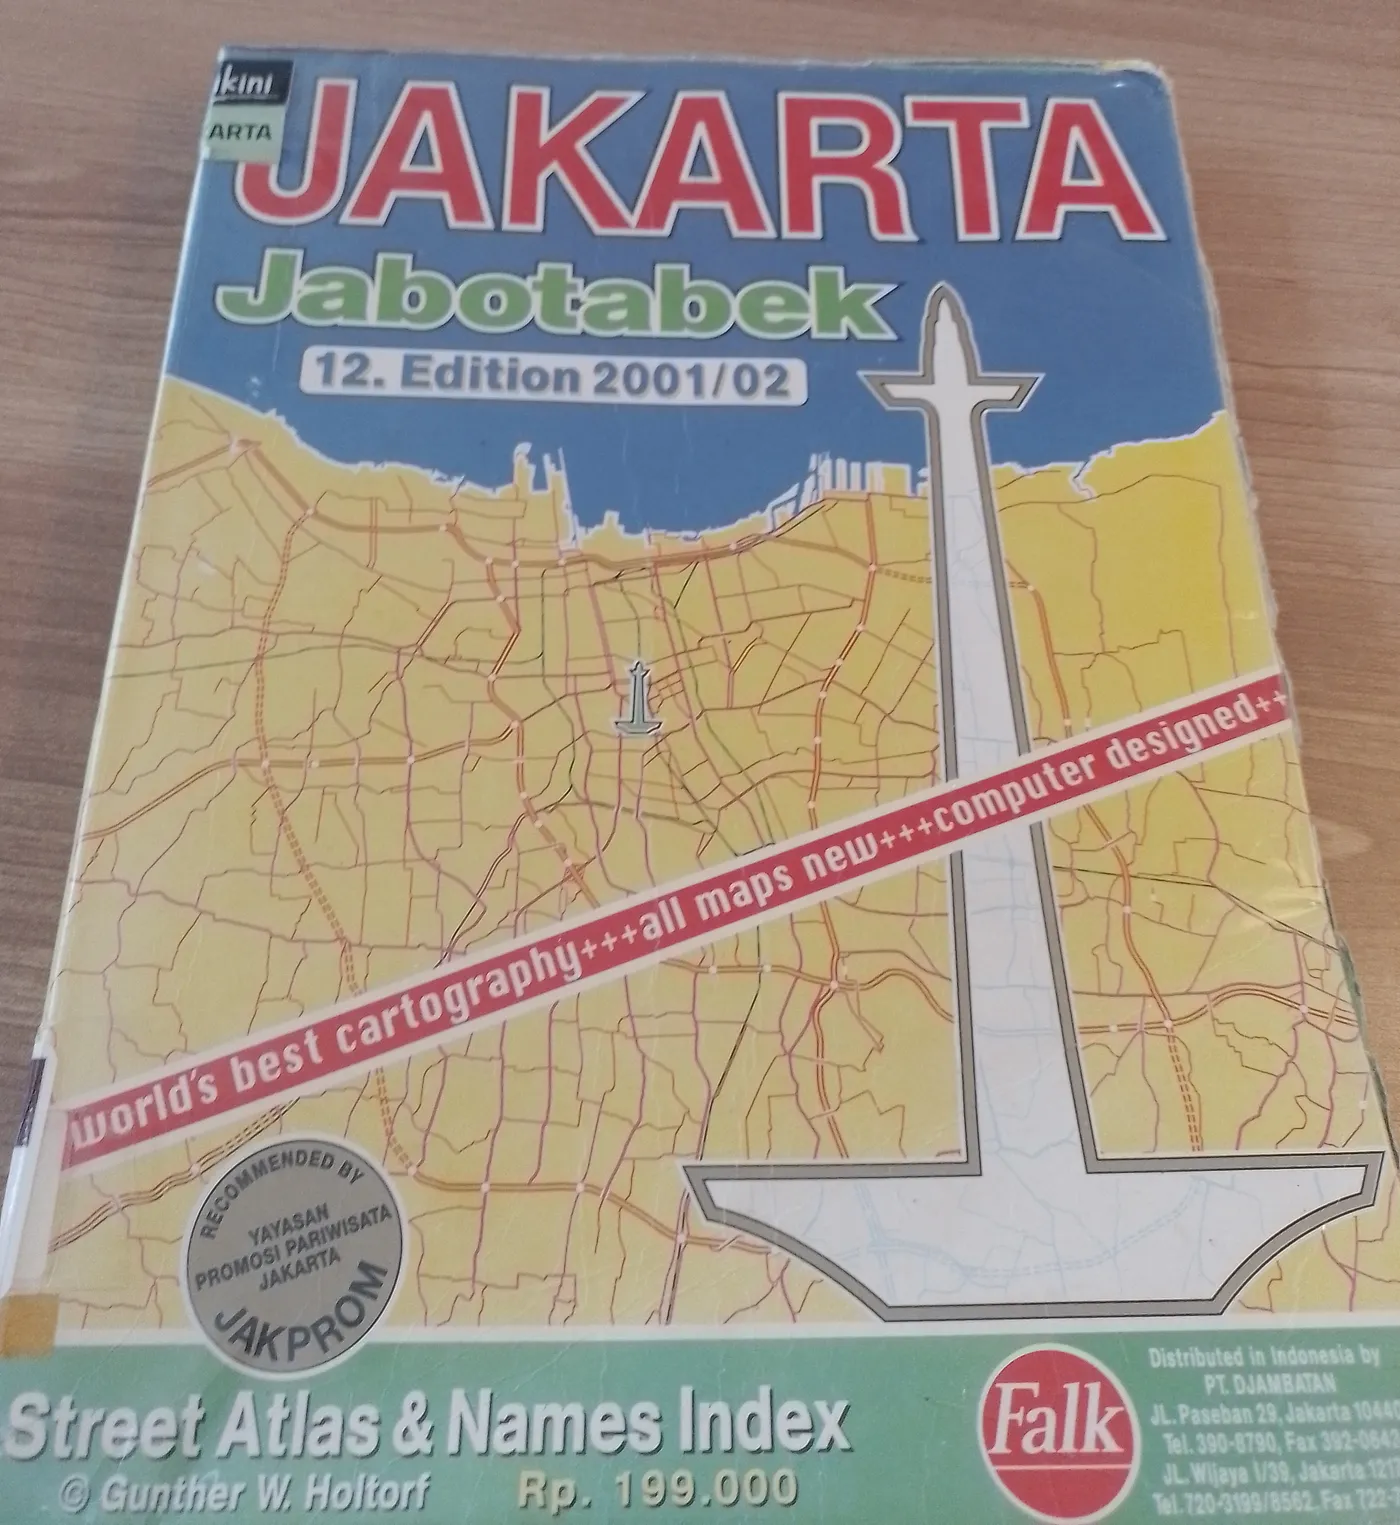
In 1973, Gunther W. Holtorf was assigned as the manager of Lufthansa in Indonesia.

From his first year working in Jakarta, many friends and visitors from abroad frequently asked him to act as their guide in the city. To assist his guests, despite having no formal background in cartography, he began sketching maps of Jakarta. His work proved useful and well-received, encouraging him to create a more detailed and comprehensive map of the city.

To achieve this, he initially approached the Jakarta City Planning Office. Instead of obtaining the topographic maps he sought as a base, he only found outdated maps of the city. This situation led the local civil servants to encourage him to produce a new map.

Gunther accepted the challenge. Every weekend, he explored Jakarta, navigating its narrow alleys and streets by foot, bicycle, and car. In addition to his weekend excursions, he also dedicated time each morning from 6:00 to 9:00 before heading to his office.

See full entry

Tagging For The Renderer

Posted by rphyrin on 18 March 2025 in English.

There’s a saying in a certain article on the OpenStreetMap wiki that “tagging for the renderer” is equivalent to “lying to the renderer.”

Not only that, but the article also restricts the definition and meaning of “tagging for the renderer” as “the bad practice of using incorrect tags for a map feature so that they show up in the mapper’s renderer of choice. Such tagging goes against the basic good practice principles.”

I think that “tagging for the renderer” as a term should first be treated as neutral. On its own, there is no implication that “tagging for the renderer” forces us to lie to the system. Sometimes, people want to do tagging for the renderer simply because they want to place cool symbols around their area in OSM Carto.

Take me, for example.

Several months ago, I decided to download the entire openstreetmap-carto GitHub repository to analyze all of the (cool) icons contained within it and determine which tag combinations were needed to summon such icons on the OSM default map tile.

I found that the charging station icon was really cool. I loved its light blue color scheme, and its visibility on the map tile was quite good—it was already displayed at zoom level 17, on par with bank, gallery, and embassy icons.

I wanted to place this icon around my neighborhood soon. But alas, I didn’t know where any charging stations were located. So I shelved this idea for weeks and months.

Then, during a work trip to Bandung, while walking past the campus I attended as a student several years ago, I finally saw one. A charging station in the wild! It was stationed right in front of the parking area of the Labtek V building.

I was so elated—it felt like finding a legendary Pokémon in the wild! At that moment, I immediately stopped walking, opened Vespucci, and mapped the charging station.

See full entry

Severe floods and landslides devastated Sukabumi Regency, West Java, after two days of intense rainfall, with over 100 mm of rain falling in a short period, according to the Meteorology, Climatology, and Geophysics Agency (BMKG). On Wednesday, December 4, the overflow of the Cikaso and Cibening Rivers inundated numerous areas, displacing residents and severing access roads. The hardest-hit areas included Palabuhanratu, Sagaranten, and Pabuaran. Floodwaters reached heights of 80–90 cm, submerging homes and halting transportation.

In Sagaranten, neighborhoods like Kampung Rangcabungur faced dramatic rescue operations as narrow alleys flooded waist-deep. Rescue teams, battling strong currents, evacuated several infants and their mothers. “We successfully rescued two to three babies. It was a tense process, but thankfully, everyone was saved,” said the Head of the Sukabumi Police’s Samapta Unit.

See full entry

OpenStreetMap - Debian 12

Posted by rphyrin on 30 November 2024 in English. Last updated on 29 May 2025.

January 29, 2023

On running sudo apt update, users will get a notification similar to this, stating that several packages from the universe repository have security updates that require Ubuntu Pro:

The following security updates require Ubuntu Pro with ‘esm-apps’ enabled: imagemagick libopenexr25 libmagick++-6.q16-8 libmagickcore-6.q16-6-extra libmagickwand-6.q16-6 imagemagick-6.q16 libmagickcore-6.q16-6 imagemagick-6-common

February 10, 2023

Currently we run a combination of Ubuntu 20.04 LTS and Ubuntu 22.04 LTS across our server estate.

Ubuntu 20.04 has recently moved away from the established 5 years of maintenance updates and now requires a paid Ubuntu Pro plan to receive some package security updates.

We’ve also had issues with Ubuntu not fully supporting the packages they source from Debian (e.g. : Apache2 which required us to backport a fixed version to workaround an issue affecting mpm event scaling).

Ubuntu has also caused us issue with some packages now only being distributed as snap packages (e.g. : Firefox).

February 20, 2023

Your Ubuntu LTS is still secured in exactly the same way it has always been, with five years of free security updates for the ‘main’ packages in the distribution, and best-effort security coverage for everything else. This has been the promise of Ubuntu since our first LTS in 2006, and remains exactly the same. In fact, thanks to our expanded security team, your LTS is better secured today than ever before, even without Ubuntu Pro.

Ubuntu Pro is an additional stream of security updates and packages that meet compliance requirements such as FIPS (Federal Information Processing Standards) or HIPAA (Health Insurance Portability and Accountability Act), on top of an Ubuntu LTS.

As part of our global mission to amplify the impact of free software, we offer a free personal subscription to Ubuntu Pro that covers up to 5 machines.

November 24, 2023

Servers fume and grisu are now running Debian 12.

See full entry