
On November 15, 2022, the Silver Line Extension in Washington D.C. will open. I edited the new Silver Line stations (Reston Town Center, Herndon, Innovation Center, Washington Dulles International Airport, Loudoun Gateway, and Ashburn) to reflect the new opening date and add more information about them. Still, I was wondering when I should actually route the Silver Line through the new stations, should I do it now since we know the opening date or should I wait until November 15? In addition, I know that Metrobus, Loudoun County Transit, and Fairfax Connector plan on changing, adding, or removing routes to coincide with the new openings, when should I start changing this on OSM?
Diary Entries in English
Recent diary entries
I am currently graduate with BSc in Environmental science and management from Sokoine University of agriculture. Being a geospatial data enthusiast, I have 2 years of open data experience, working as a remote mapper from SMCoSE Youth mapper and Open Map Development of Tanzania (OMDTZ) in the projects mapping the unmapped for flood resilience, by mapping the extent of this project it provides the better understanding of the problems to the community.
I am also currently among the Crowd2Map intern for the year 2022, these internship programs aim in promoting open data quality, delivering quality data and putting rural Tanzania on the map. I am motivated to participate in this excellent opportunity to learn more about open data and also learn how to provide quality data. Through this program, I hope to improve my knowledge of validation.
i am not sure if when adding new places with organic maps while beeing offline, they get added or just stay on my phone.
travelling the world by bicycle with osm
Posted by Hans Thompson on 31 October 2022 in English.
Mountain names. A new front in the never-ending cacophony of US political discourse.
Two recent mountain peaks had their names changed by the US Board on Geographical names and there is disagreement in the change sets on whether the name given should be the new indigenous name given by the US Board or the English translation of the US Board. To be clear though, I have not seen the official name from a primary source.
The two peaks were promptly edited to their new names in the local Dena’ina (North and South Yuyanq’ Ch’ex) but within 24 hours changed to what I assume is the English translation of the new Dena’ina name (North and South Heaven’s Breath).
To me it seems like a cut and dry answer based on osm standards what should fall in the “name=” attribute. The editor that changed it to the English translation may feel otherwise though so and to avoid a change set dispute I emailed the Data Working Group to get their decision. I haven’t heard from them in over 10 days however and I haven’t received a message to my follow up email on whether my email got to them. If anyone is on the DWG is interested in bringing me on to handle these issues, I would volunteer. For now though, I’ll hold off on changing the name back and hold faith in the process.
news article:
relevant changesets:
Posted by SHABANI MAGAWILA on 31 October 2022 in English.
Last updated on 3 November 2022.

Mapping
In this diary, I’m trying to show some tips and tricks which can be used by beginner, intermediate, and advanced mappers to improve their mapping capacity and speed up mapping. Hopefully, you will learn a lot and enjoying with these simple tricks. Have fun, and you can even comment and ask in case you need further assistance and training. Welcome, all!
Java OpenStreetMap Editor (JOSM)
[Issue1:] How to Map Batch Orthogonal Building
In this scenario we're going to use Mapathoner Plugin in JOSM to draw a batch of Orthogonal Building. So, first, make sure you install Mapathoner Plugin in your JOSM.
[Issue2:] How to Map Batch L-shaped Building
[Issue3:] Draw a Courtyard Building
Validation
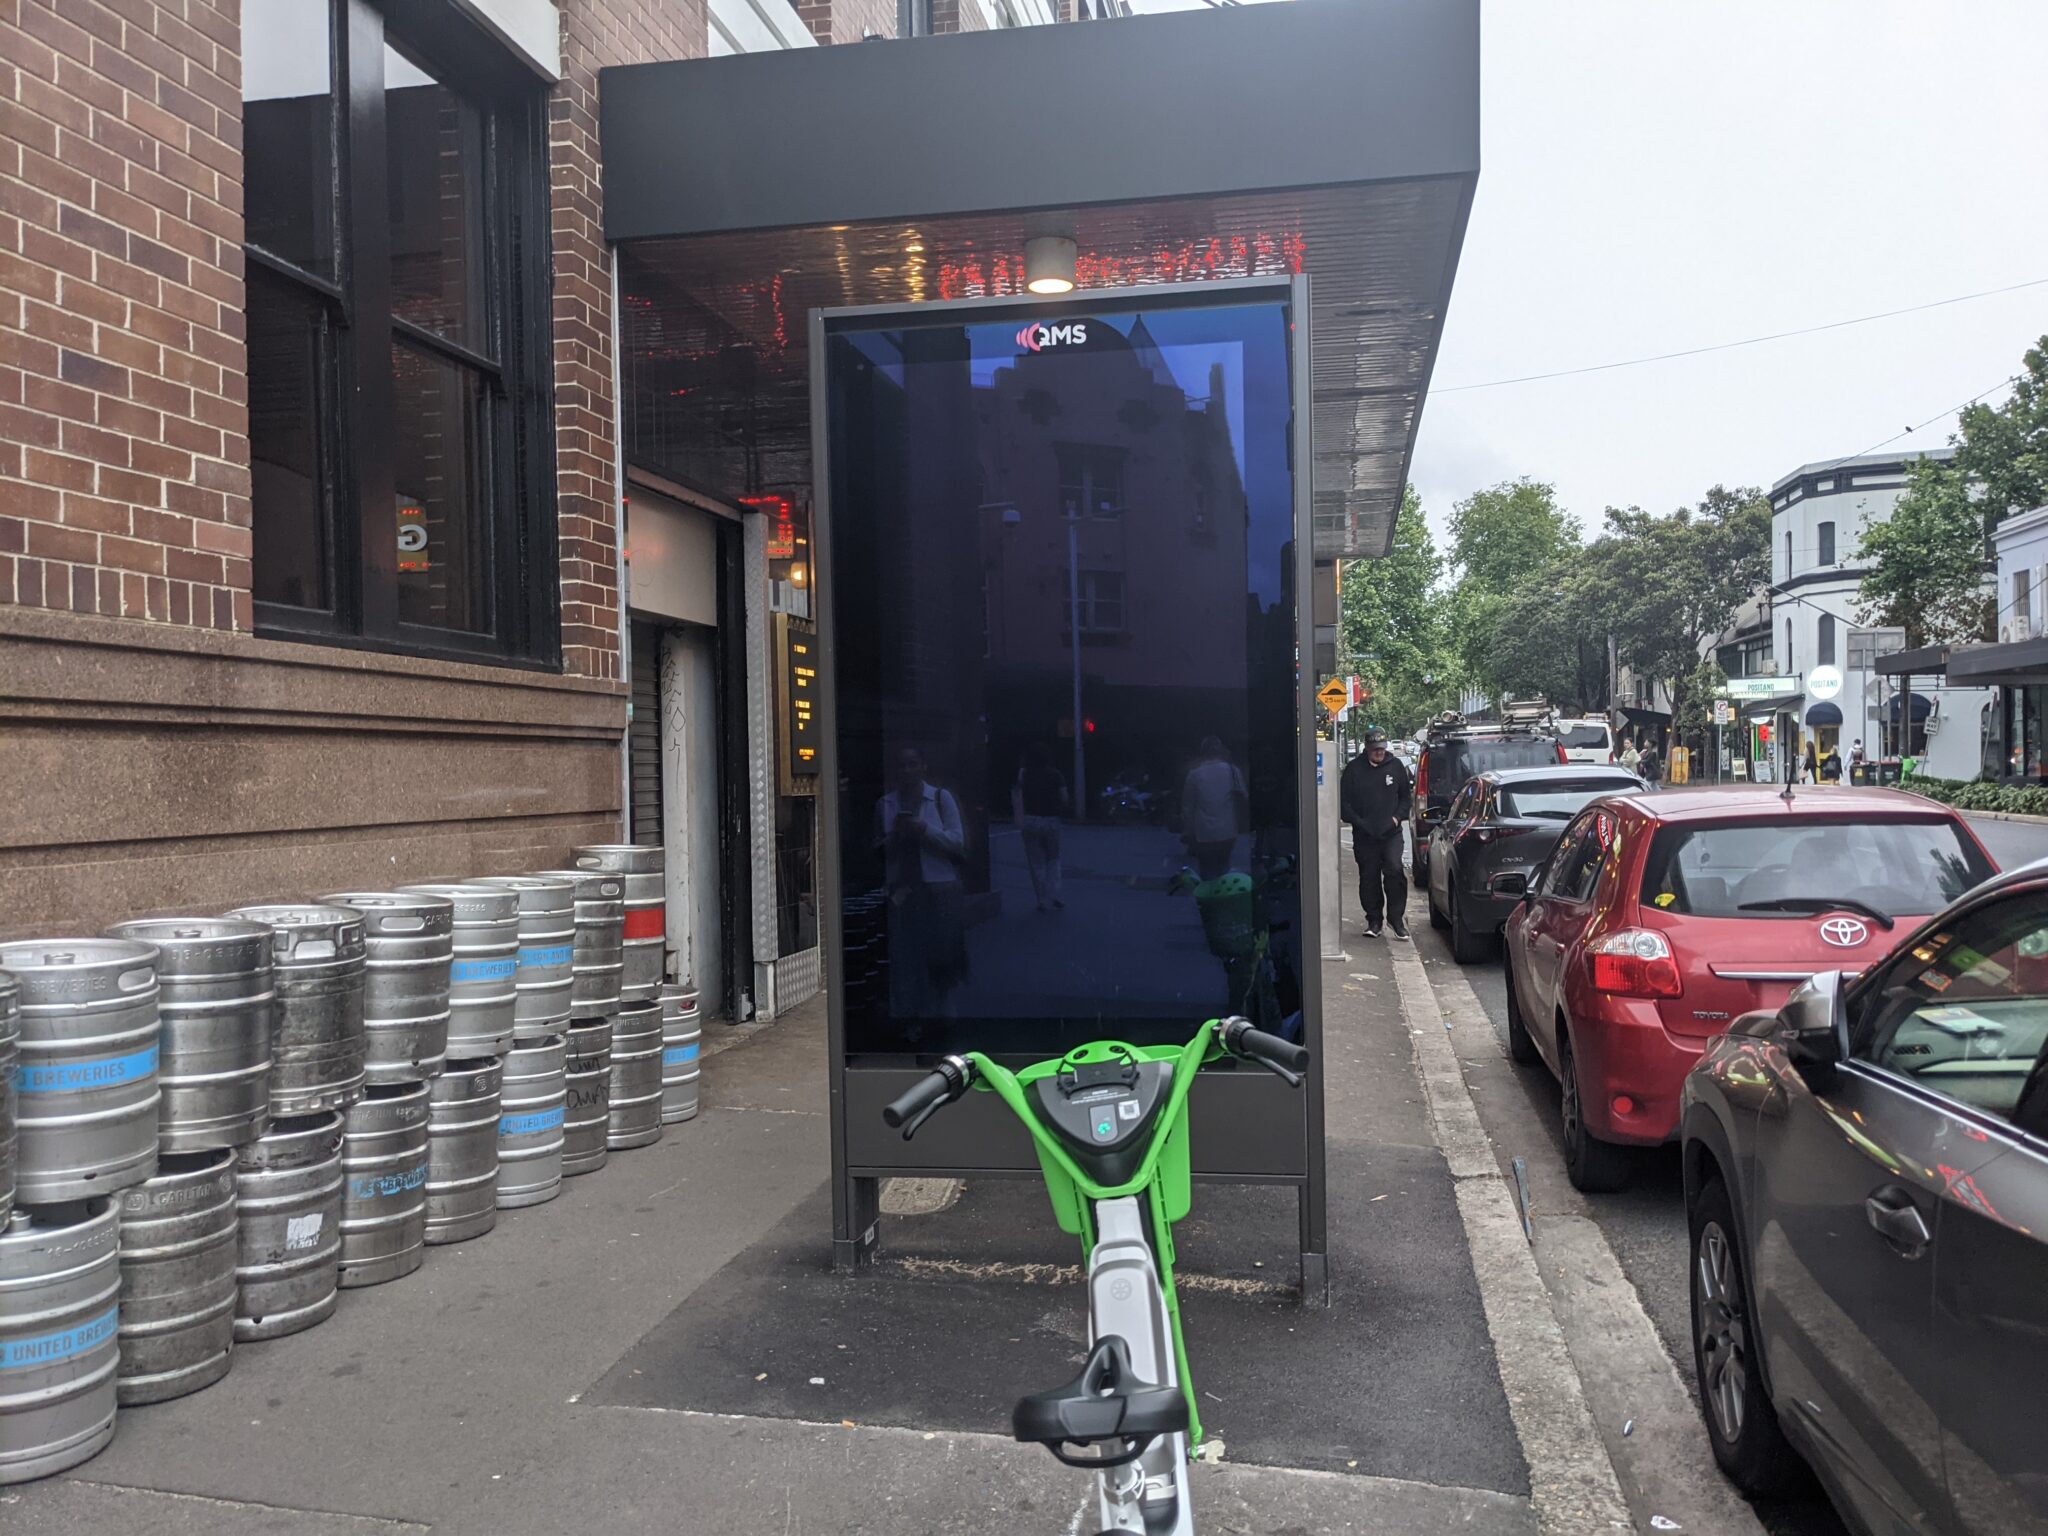
At first, many new mappers make a lot of mistakes during mapping. And, this can be caused by some reasons, such as little experience in mapping. Therefore, this part will guide them on what to do and do not, as well as demonstrate some previous mistakes done by mappers.I wrote a blog post about the new advertising panels being installed in the Sydney CBD, and created a map which imports the OSM data using Overpass Turbo.
Through August and October I visited every QMS advertising panel. I surveyed their location and ref code to add to OpenStreetMap. I uploaded photos of many displays to Mapillary, which you can view by clicking on pins in the map.
Let me know what you think! Any feedback on improving the tagging is also appreciated.
Track: osm.org/user/warumichRadfahre/traces/5237564
Photos: https://1drv.ms/u/s!AhrBI8Ihd76i1T7neTUhVsUUivU5?e=bo3Evb
Bike: #TheViper
Posted by amapanda ᚛ᚐᚋᚐᚅᚇᚐ᚜ 🏳️⚧️ on 30 October 2022 in English.

- Maps & Hacking
- I did some hacking & made some maps, see:
- “Very Fast Money Withdrawl. Distance to the nearest bank for every weapon shop.” 🐦 🐘
- “The worst night club for a durty take away after chucking out time: Distance to the nearest fast food place for every nightclub” 🐦 🐘
- Made a map of distance from thatch building to nearest fire hydrant. twitter post🐦, 🐘
- To do this, I “needed” to create a new tool/script. It’s
osm-distance-to-nearestand available on GitHub. You can make maps like this. 🐦 🐘
- Analyzing OSM changeset data, and found weirdly empty changeset tags. 🐦 🐘
- I did some hacking & made some maps, see:
- Inspired by a community member, I asked osmose if they want to get on the
en.osm.townfediverse.- Remember folks, in OSM, no-one is coming to save you, we have to save ourselves.
- I tried to make DALL-E generate some OSM images, 🐦
-
OSMF Board
- Trademarks
- Emailed several event organisers, to organise trademark licences for their regional State of the Maps.
- Replied to one organizer, that as a local chapter they don’t need a speical licence (it’s included in the Local Chapters Agreement)
- Local Chapters minor beurocracy for 2 potential LCs
- I checked that the same person is OK with doing the questions for the Board AGM
- Trademarks
(As I mentioned, I finally caught corona. Combined with a lack of energy, this is a bit shorter)
Previously…
| 2022 | Jan. | Feb. | Mar. | Apr. | May | June | July | Aug. | ||||
| 2021 | Jan. | Feb. | Mar. | Apr. | May | June | July | Aug. | Sept. | Oct. | Nov. | Dec. |
| 2020 | Jan. | Feb. | Mar. | Apr. | May | June | July | Aug. | Sept. | Oct. | Nov. | Dec. |
Track:
osm.org/user/warumichRadfahre/traces/5232776
Pics: https://1drv.ms/u/s!AhrBI8Ihd76ixlCjy_xRIrqfeHc5?e=dWfA8U

This is a Tasking Manager for Disaster response mapping for Flash Flood in Jembrana District, Bali in October 2022
I pleased to contribute in order to find response to the areas affected by floods and landslides due to heavy rainfall in South Africa through mapping.
I am thrilled to have my first session with OSM Rwanda, This is where Geospatial data are free woow!!!!
I am so pleased to attend this training of the Rwanda monthly mapathon today being 29th October 2022 at Classic Hotel
Posted by RUGENGAMNZI Gilbert on 29 October 2022 in English.
It is my pleasure to attend that event (unique mappers network Nigeria collaboration with OSM Rwanda to map Rwanda Monthly Mapathon). I have earned more skills, which will help me to improve my mapping skills so that i can edit too many features like roads, buildings and many others, which will help me to contribute to global spatial data.

It’s an amazing opportunity being one of the mappers around, kudos to the OSMRwnda chapter and The #UniqueMappersNetwork for this training
I am very happy to be one of the contributors of map Rwanda, this is my first mapping and I will keep mapping,
Thank you
As some will know by now, crannogs are my “thing” at the moment. I was hoping to produce a couple of videos about them on my channel, but it takes a bit longer to get the tag approved than expected. And I can’t tell people how to map crannogs when there is no standard.
But I digress…
While mapping buildings in Co. Cavan in Ireland, I had discovered 12 suspiciously circular features in the lakes within the last 3 weeks, and I had reported them to the National Monuments Service this week. They got back to me yesterday and confirmed 3 as actual crannogs (the rest were apparently just naturally occurring circular vegetation).
If you want to check them out, Bing or Esri Clarity imagery are best.
There are a couple more to report, but I’d rather do it in bulk than send an email every 3 days or so.
I made a quick video about it: https://youtu.be/7BJukQ8hKXw
Posted by rhythmicbalancer on 28 October 2022 in English.
Last updated on 29 September 2024.
So, two of my interests are tagging waterways and highways. And of course, where they intersect, there is often a bridge. Here is how my bridge tagging method has progressed over time:
-
Bare minimum - split the highway (using e.g. aerial imagery), set
bridge=yesandlayer=1. This is conventional, if not particularly informative.
Then I found the National Bridge Inventory, which contains not all, but certainly many of the significant bridges in the USA. This data is quite interesting, it includes detailed info on the bridge structure and its integrity.
One can use this to verify the length of the bridge as drawn on the map, in many cases what’s shown in aerial imagery matches to within 1-2m of the specified length. You can also find data on when the bridge was constructed or rebuilt.
-
Added context - add
start_datetag.
Today, I was thinking, it’s not much more difficult to add an area object for the bridge structure itself using the man_made=bridge tag. In fact, one could then move such tags as start_date and bridge:structure into the separate object.
There is also an existing Here’s my idea. What if we used the NBI structure/bridge number, where available (in the USA)? You might wonder why that would be useful. bridge:ref tag which is loosely defined.Well there is a site https://bridgereports.com, which parses the NBI database with some additional refinements, and displays a nicely formatted summary. A plugin might use the structure/bridge number to display such data.
Something like the following. For the highway:
bridge=yes
highway=secondary
layer=1
ref=KY 218
And for the bridge structure [edit: updated per discussion in comments]:
ref:US:nbi:state_code=21
ref:US:nbi:structure_number=044B00032N
structure=beam
layer=1
man_made=bridge
start_date=1978
Here’s how the metadata could be displayed (using bridge ID “044B00032N”):
https://bridgereports.com/1211803

Not only “the mole people” live underground, as there are large urban areas, publicly accessible, built below the ground level, and indoors in general.
As an example of an indoor world: Easton Helsinki, in Finland, which has about 4.8 million visitors per annum. (Source.) It’s built on multiple levels. OpenStreetMap doesn’t yet have support for such multi-levelled maps, but it could: a level is just a layer.
Mostly underground is the bus terminal at Kamppi, in Helsinki. It has elevators and escalators carrying countless people up and down, in and out of tunnels and halls. Most of this world underground isn’t yet seen in OpenStreetMap.
.webp)
TL:DR River Polygons with river lines good, river lines alone bad.
Water Body digitization is the base line of water networks on openstreetmap. Every point, line, and polygon has been either manually created or generated through a computer application. Much like roads, rivers and other water bodies can be and sometimes are crucial resource for transporting goods.
Historically, cities and small towns were generally near a water body for drinking/bathing water, cargo transportation, and in the past one hundred and fifty years rivers are used for electric power generation.
Water Body Polygons are used in all types of maps so why not make these features correct by providing a more detailed polygon over just providing a line.
EX. The Sprague River in Klamath County Oregon is a perfect example of having many twists, turns, islands, and variable width across it’s path. Detailing these features in larger scales may not be as necessary as smaller scales below 1:150,000.