OpenStreetMap logo OpenStreetMap

Diary Entries in English

Recent diary entries

Posted by Growebis on 22 April 2023 in English. Last updated on 15 May 2024.

Edit: The imagery, according to one commenter, needs permission from the governement to be able to use it, my bad for mentioning a WMS link that i though had an open license to it.

Edit 2: Someone uploaded the database of Montreal buildings. Thanks for everyone that helped.

i swear i might have a dream of me just adding buildings in OSM but can i like, get some help with adding the buildings because this is gonna take too long. if anybody is actually reading this then if you want to help me, add buildings using Geodesie Quebec satellite as its 100% accurate , you just need to add parameters for it to function as custom satellite. https://servicescarto.mern.gouv.qc.ca/pes/services/Territoire/RESEAU_GEODESIQUE_WMS/MapServer/WMSServer

Posted by jpennycook on 21 April 2023 in English.

I’m slowly catching up with the mass of data I’ve collected over the past couple of years - uploading footage to Mapillary and the use of OSMUK Cadastral Parcels have improved my editing but vastly increase the time it takes to edit the map. Plus I’ve found other things to do in my spare time.

I’m probably going to pause my Isle of Wight edits now, work on some south of Basingstoke, then try to make it out to Farnborough, Woking, and Wokingham to make sure my data isn’t out of date before editing the map round there.

Posted by b-unicycling on 21 April 2023 in English. Last updated on 22 April 2023.

In my last diary post, I had written about the beginnings of mapping milk churn stands. This was kindly featured in the weeklyOSM 662 which resulted in a bit more attention from the OSM community from several countries. Thanks for all your kind comments!

Progress

When I ran an overpass-turbo query on Easter Monday, I noticed a sudden increase of mapped milk churn stands in Finland, a considerable increase (which has still grown more). I checked the changeset history to see who had caused this, found out it was user houtari and sent him a message to thank him. What followed was a very interesting exchange about milk churn stands in Finland. He even sent me a link to a most interesting article in Finnish, kindly translated by a certain popular translation website, but I’ll give you the original link, so you can decide what to use:

It also led us to translate the wiki page into Finnish.

See full entry

Location: Ekonen, Viiskulma, Jämsä, Jämsä sub-region, Central Finland, Mainland Finland, 42101, Finland

OpenStreetMap (OSM) is an invaluable resource for geospatial data, providing free and open access to information about our planet. One interesting aspect of OSM is its ability to track the history of changes made to objects in its database. As someone curious about geospatial data, I’ve been exploring ways to visualize this data in a more intuitive manner. Recently, I decided to experiment with GPT-4, a state-of-the-art language model by OpenAI, to see if we could come up with a fresh approach to visualizing OSM data history. In this blog post, I’ll share my initial attempts, examples of the traditional OSM Deep History table, and the new visualization I created with GPT-4’s assistance.

Traditional OSM Deep History Table

The standard OSM Deep History page presents data history in a tabular format. While it’s a helpful tool for understanding how objects in the database have evolved, the table format can make it difficult to quickly grasp changes and trends in the data. The table includes a row for each version of the object, with columns for different attributes. As a result, finding meaningful insights can be challenging.

See full entry

Posted by Anton Khorev on 20 April 2023 in English.

Normally the edit button on the osm website is hidden on phones. That’s because you probably don’t have any remote-control-capable editor installed and iD is unusable on small screens. What you’re supposed to do instead is open the Share tool and tap the Geo URI link. This will let you launch any app that understands Geo URIs such as Vespucci.

But to my surprise I was able to use iD on a phone. My note viewer has a tool to open iD on the current map location. It should work similarly to the Edit button except it won’t disappear if the screen is too small. Actually it is hidden by default because too many tools would clutter small screens. But you can always add it back by pressing the ⚙️ button.

When I opened the link, I noticed that iD looks differently compared to what you usually get on a phone. I expected to get that oversized sidebar covering most of the screen. Instead I got everything scaled down to fit on the screen. That happened not because of any changes in iD but because note-viewer opens iD differently.

See full entry

It has been a busy time for OpenStreetMap Zimbabwe Community forging ahead to set it’s foot within the Global OpenStreetMap Family. This year started enormously with the introduction to the Anticipatory Response Program for Muzarabani.

OpenStreetMap Zimbabwe is one of those communities that is still emerging and testing the waters in pursuit of a safe landing space. I am sure it’s all smooth surface but not so easy to be well established. Starting up a community or resuscitating one is no little work; you sweat it out, you cry it out and you scream it out. Only commitment and dedication will see you through the winning point. Over the last couple of years, OpenStreetMap Zimbabwe has been active in terms of the YouthMappers Chapters. Vivid and energetic, the young mappers have been very enthusiastic, raising their home flag high. This year, tables should turn or rather tables should balance.

OpenStreetMap Zimbabwe jump-started this year at a climatic point with the first massive Mapathon ever which also served as an introduction to the Anticipatory Response Program for Muzarabani. The community which gathered at the University of Zimbabwe on the 20th of March 2023, made tremendous efforts to put Muzarabani on the map. The tasks cleared way for the Disaster Response Deployment which then took off the next day in the Muzarabani District. The occasion was rich in attendance (80+) from various institutions and organizations like the Chinhoyi University of Technology, Midlands State University, Harare Polytechnic, University of Zimbabwe, Zimbabwe Institute of Geomatics, Surveyors Institute of Zimbabwe, independent participants and supported by the Eastern and Southern Africa Hub (ESA). Training was led by Deogratius Kiggudde while the Zimbabwe Steering Committee and ESA (Jomokela Kennedy, Wilson Munyaradzi, Michael Osunga) chipped in to attend to the floor. It was a huge success.

See full entry

About HIFLD

OSM power user SherbetS has been documenting the HIFLD dataset. It is a large corpus of public domain licensed geospatial information about infrastructure around the United States.

Get all the data into JOSM

Download the dataset in GeoJSON format here. Fire up JOSM and open the file. This will create a layer that is just the HIFLD data. If won’t have any fields that look like OSM fields so DO NOT upload this directly.

Next we need to get the OSM data into JOSM. For this demo we will use the data for the state of Wyoming.

  • Click the green download button to open the Download dialog.
  • Click the “Download from Overpass API” tab at the top.
  • In the Overpass text box put something like:
// fetch area “Wyoming” to search in
{{geocodeArea:Wyoming}}->.searchArea;
// gather results
(
  // query part for: “amenity=hospital”
  nwr["amenity"="hospital"](area.searchArea);
  // query part for: “amenity=clinic”
  nwr["amenity"="clinic"](area.searchArea);
);
// print results
out body;
>;
out skel qt;
  • Hit the “Download into new layer” button at the bottom

We now have 2 layers. One with the HIFLD data and one with the OSM data.

Finding unmapped items with the conflation plugin

We will now use the Conflation Plugin to match the nodes in the HIFLD dataset with OSM downloaded elements. Any elements that do not match to an OSM item should be reviewed and additions made. Any matched elements may be reviewed for completeness in OSM but that’s a separate matter.

We will start by selecting elements from the HIFLD dataset that are in our state of interest (“WY” in this case) and add this to the Conflation tool as the “Reference”. This is the set we’re trying to match elements to.

See full entry

As there have been lots of updates recently, I’ve made a new release of all of the code behind map.atownsend.org.uk

There are releases for four repositories - the lua code that does all the hard work, the map style that determines what it looks like, the map legend, and the website for the map itself.

Here’s a summary of what’s new:

Natural features

Rocky features are now shown in more detail:

See full entry

Location: Seamer, North Yorkshire, York and North Yorkshire, England, United Kingdom
Posted by SK53 on 13 April 2023 in English.

For a number of years I have sporadically looked to resolve missing speed limits on major highways (highway=trunk and highway=primary) in the UK. I use a simple Overpass query to find these in a manageable area (usually former regions of England + Wales, Scotland and Northern Ireland.

The other day a discussion arose on IRC about some distinctly English placenames in North Wales. Looking at the area I realised that the A493 had no speed limits added. As both Mapillary and now Bing Streetside imagery are now available in the iD editor, I was able to add limits from Aberdyfi to Tywyn. In the past this nearly always required a survey.

I was going to write about looking at limits elsewhere, but found it easier to add various pictures in a short Mastodon thread.

tl;dr: There’s lots of work everywhere to improve the mapping of maxspeed on highway=primary.

Location: Aberdovey, Gwynedd, Wales, United Kingdom
Posted by KAWAMALA on 11 April 2023 in English.

Hello World!

Not a new word to you right?, so do the contents…

In the past few years I have been organizing and conducting Mapathons or Mapping Parties as known to many of you, through that experience I have been able to develop this guideline to help individuals and organizations towards organizing successful Mapathons, I know it is not easy and always an overwhelming process but exciting when it goes right, HahaH, recently at Ardhi University, Dar es salaam, Tanzania I conducted a Mapathon, It was no joke, 60+ alumni, students, and OSM community members joined forces to learn the ropes of mapping and networking, facilitated by @rootgis

We couldn't have done it without the amazing support from HOT ESA HUB and the Spatial People Network program , thank you so much for the funds and resources to make it all possible!

During the mapathon Buildings, Roads , Land Use and Point of Interests were mapped and all data generated were added to OpenStreetMap (OSM).

Wow, talk about a productive day! >>Fast Forward

Therefore...

A mapathon is an event where brothers and sisters come together to map a particular area for a given purpose few of them being Refugee Response, Disaster response, Transportation, Disaster Preparedness, Public Health, Water & Sanitation, Sustainable Cities, Agriculture, Poverty Elimination, Environment, Gender Equality, Clean Energy, OSM Community, Disaster Recovery, you mention it.

The goal of a mapathon is to create accurate data and maps that can be used for humanitarian, development, Refugee Response, Disaster response, Transportation, Disaster Preparedness, Public Health, Water & Sanitation, Sustainable Cities, Agriculture, Poverty Elimination, Environment, Gender Equality, Clean Energy, OSM Community, Disaster Recovery

So what to do when planning for a successful mapathon ?:

See full entry

I’d like to note a few things that are rather inconvenient when working with this setup.

Firstly, this causes neck pain! When I’ve got my camera mounted and recording, the combination of the extra weight plus the aerodynamic profile make this camera very cumbersome on the neck. you will notice right away a mild pain in the back of your neck.

Secondly, dropping. I’m pretty clumsy, and after a good ride I come home and start taking everything off, primarily the camera off the helmet right away to alleviate the pain. I haven’t got a good place in my garage to set the camera down, so I hold it awkwardly while I try to open my bike crate, camera box, etc. and put things away. Twice now I’ve dropped the camera on the ground, and the first time it scratched the main lens pretty bad, and the new mark is visible on the newest photos I’ve taken.

Unfortunately, I haven’t had the tools for any superior camera mounts. My bike isn’t very conductive of temporary stick mounting, and all the selfie sticks I have are of a less than satisfactory length to use as a standalone system. I’ve thought about mounting it to a backpack like I used to do with my old LG360, but that suffers from lots of shake and insecure mounting. tying down all the straps on my backpack still made the stick wobble, and made it very inconvenient to work with.

I’ve also recently had an issue with the version of OsmAnd that I’m using, the latest version has a glitch that makes the currently recording track disappear if the start point isn’t on the screen. https://github.com/osmandapp/OsmAnd/issues/16947

All that aside, it still is rather easy to set up, and it’s not difficult to ride around for an hour or so and get some footage quickly.

Posted by cartofy on 6 April 2023 in English. Last updated on 2 May 2023.

The OSM Urban Road classification guidelines for India dictate a number of high-level directions on mapping roads in Indian cities. When Devdatta and I tried to fix some classifications in Pune, we realised that the current guidelines don’t provide a solid base for decision making, in an “if X, then Y” way. So we decided to observe, annotate, experiment and retrospect on whether a classification makes sense.

We realised that to map a road, one must understand how a road is perceived, and its purpose in the larger scope of the neighbourhood, locality or city. This gives the road a purpose, and that purpose defines its classification. The purpose or intent of the road is not enough to classify it, so we tried to observe a few other factors that characterise roads in major Indian cities. Here’s what we found.

  1. Much like a river, a road begins somewhere and merges into another road. As roads connect with each other, the larger road essentially “collects” traffic from a smaller road. However, it is not necessary that a smaller road feeds into a larger road. Often, it might feed into a road of the same size, but with elevated purpose.
  2. Some roads serve the same purpose but could vary wildly in their characteristics, including the width of a single lane.
  3. Many collector roads can be easily identified using tell-tale signs such as the presence of speed bumps, traffic signals and dividers.

The observations led us to try and categorise roads based on a few factors:

See full entry

We know from the pilot HOT unSummit programme that we need a better name (too many people thought it referred to the United Nations!)

Can you help us think of one?

Cuauthémoc putting up an event banner at a geography student conference in Mexico

It need to encapsulate one, some or all of the following aspects…

  • It is a programme that supports / collaborates on open mapping-relevant events all over the world
  • The objective is to inspire people and give them the means to take collective action on humanitarian / social problems through open mapping and OpenStreetMap
  • It seeks to expand and strengthen the humanitarian open mapping movement
  • It is supported by / powered by HOT, but in collaboration with many communities and organising committees

Once we have a new name, we will update the branding and the next phase of the programme will relaunch in June.

See full entry

Let’s recap some work done on the damn project.

Divide and map. Now. – the damn project – helps mappers by dividing a big area into smaller squares that people can map together.

As outlined in Work for 2023, I have been working on the improvements to the web clients. The consequences are better clients and easier deployment (which is not yet documented). Also, I have restructured and slightly rewrote the https://damn-project.org/ web page.

Changes to the web clients

New client for beginner mappers is out, see mapper. I was thinking of how to better describe map-review-done workflow. The original client has “Show mapping square workflow diagram” showing ASCII art square’s state flow when clicked. I had and idea to show SVG figure (generated by dot) instead of ASCII art, because it is easier to generate, maintain, and translate. SVG is text, too, so I can bare that. But wait! SVG is HTML element, isn’t it? So it’s clickable, isn’t it? So it can be done interactive, can’t be?

Mapper web client of the damn-project.org

See full entry

Posted by mvexel on 3 April 2023 in English.

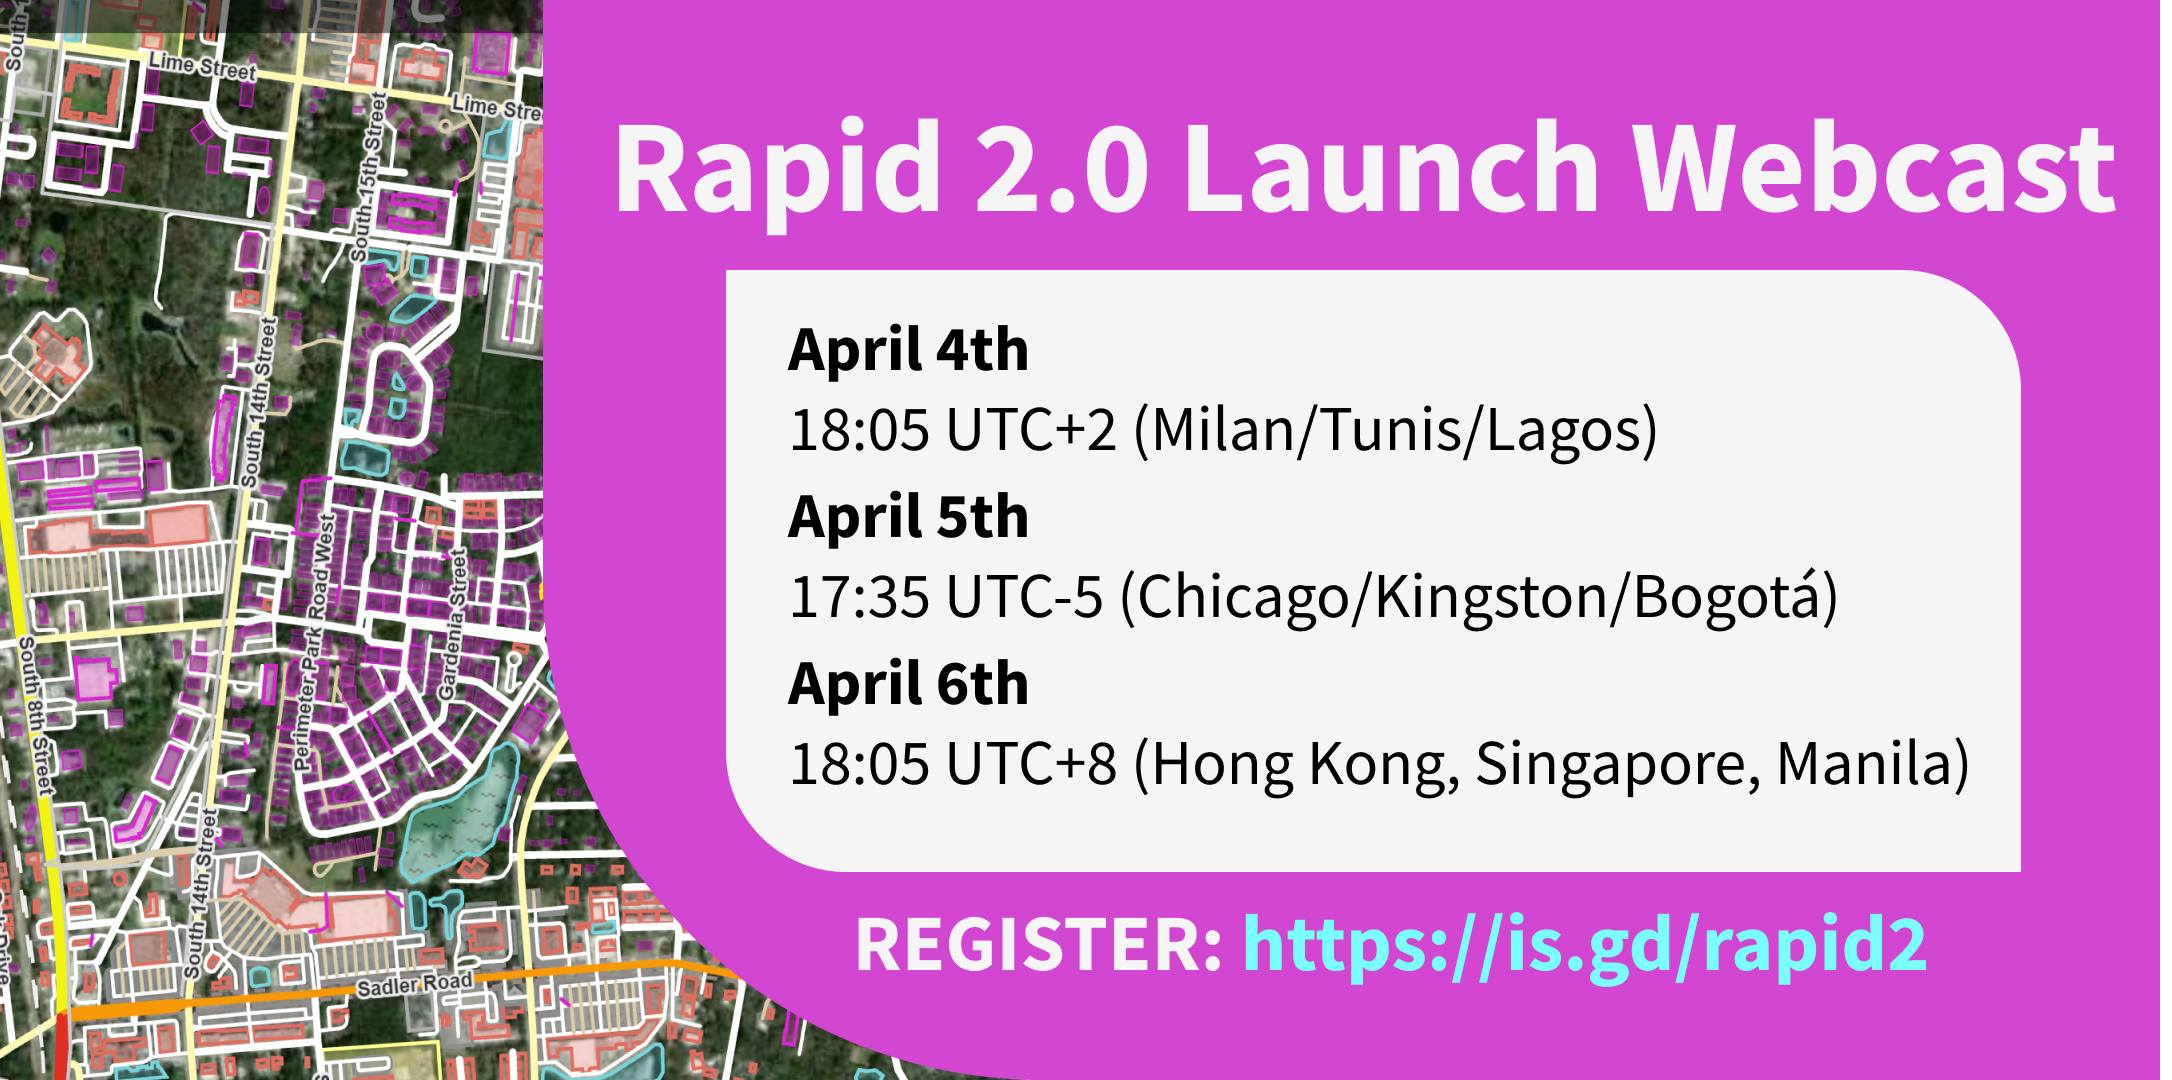
Rapid 2.0 launches this week. The Rapid team will host webcasts on April 4 (tomorrow at the time of writing), April 5, and April 6 for Europe / Africa, the Americas, and Asia / Pacific timezones respectively. You can sign up here. You can expect an overview of what’s new, and a live demo. You will also be able to ask the Rapid team questions.

Rapid webcasts promo

What’s new

I wrote about the public beta of Rapid 2.0 before, and covered what’s new there.

One additional thing I wanted to call out is the ever-growing amount of external datasets available to mappers for efficient mapping of addresses, buildings and other features available as open data. There is a page on the OSM wiki that lists them all, and Esri has an interactive map with all the data sources available and considered as Rapid layers.

See full entry

Location: Rapid City, Pennington County, South Dakota, United States