Though I am not a sophisticated mapper, I really enjoy updating the local POIs in my area. Here’s the story of one of adventures that I wrote for my town’s weekly newsletter, “Enthusiasms:
Diary Entries in English
Recent diary entries
Last week, the climate officer from my local county council reached out to me to see whether “we” (i.e. OSM) had locations for drinking_water:refill mapped. (She used to be the heritage officer, so she knows well what I do).
After some confusion about what she meant (I thought holy wells…), I found that there was one mapped as amenity=drinking_water, but without the drinking_water:refill tag.
I presume the reason she is asking is that the council wants to install more, but doesn’t know where there are already some.
Some more research revealed that there are at least two providers in Ireland, both use GoogleMaps, one not very successfully: EcoFil. In agreement with the OpenStreetMap Ireland board, I sent emails to both companies to ask whether they could make their datasets open giving the county council analysis as one example for the usefulness of #OpenData in this case, pointing out that they could also benefit from a complete dataset.
(overpass-turbo for Republic of Ireland)

😍
Introduction
The purpose of this document is to explore the possibilities of the Segment Anything Model (SAM) Segment Anything developed by Meta in OpenStreetMap mapping. SAM is a promising model in the field of image segmentation, and its potential application to fAIr could enable the tracing of various features on maps. This document provides an overview of SAM’s working mechanism, test cases conducted with SAM, and two potential integration ideas for utilizing SAM
SAM Working Mechanism
SAM operates directly on images and generates individual masks based on the training datasets used during model training. Unlike object detection models, SAM focuses on segmenting all elements present in an image, regardless of their nature, based on texture, color, and points of difference from the background and several others can be found on their research doc

Advantages of SAM for fAIr and OSM Mapping
Posted by ZeLonewolf on 7 June 2023 in English.

Thanks to planetiler, it is possible to run your own OpenMapTiles vector tile server on Amazon Web Services (AWS) for less than $20 per month. This guide describes the process that I used to stand up tile.ourmap.us for the OSM Americana project, and it does require some knowledge of AWS. However, I taught myself how to use AWS, and I’ve tried to include enough details here to assist someone trying to stand up their own tileserver.
There are many different ways to do this, including different storage, hosting, and tileserver setups. This is just one option that worked for me for what I was trying to do.
The architecture
This setup in this guide assumes that infrequent planet updates is acceptable for your use case. So, we will spin up a powerful server to update the map only when needed, and use a low-powered server to run the HTTPS tile server on an ongoing basis. If you require more frequent map updates, this is probably not a good solution and you should consider dedicated hardware. The main advantage of AWS in this use case is the ability to rent a high-performance computer for a short period of time.
Additionally, this setup assumes that you already own a domain name that you can use to point to the tile server. If you don’t have one, you can purchase one on Google Domains for $12 per year.
In our setup, we will render a planet to a large file in .mbtiles format, and use tileserver-gl to serve that .mbtiles as an HTTPS server.
Another advantage of using AWS is that they host a locally-mirrored copy of the planet file. Therefore, it is posible to download the planet in a few minutes, which reduces the amount of time that we have to rent that high-powered server to render the planet.
When we say “render the planet,” it means the following operation:

The startling regularity of these posts amazes even me. Today I went for a bit of a walk with my brother Joe’s dog, Pumpkin. It’s an embarrassing name. Joe and his kids seem to shorten it to Pumpki. My mouth and memory struggle with that so I have been trying Pumki, Pumpi and Punki. Pumpkin does not respond to anything I say so I have tended toward Dog or Hey You. I resorted to buying a packet of dog treats in a mildly successful effort to be noticed.
OSMAnd has been very handy as usual to find my way. I found a broken bit on the map and tried to fix it but I don’t really know what I’m doing. I did record my track, hopefully that’ll help someone.

For some months now, Champs-Libres has been working for the NMBS/SNCB, the national railway company of Belgium, for reusing OSM data of Belgian stations. The NMBS/SNCB has an interest in OSM data for improving some services to travelers regarding accessibility data, especially for bicycles. Have a look at the wiki page for more insights!
The first diary entry was about the basic data on the Belgian stations and platforms. In this second diary post, we’ll show how to map access to the railway platforms.
What is the access to a railway platform?
A traveler, with or without a bike, can walk to/leave a platform by several means of access. We’ll call these “access objects”, which can all be mapped in OSM. Here is how to map these access objects and how they are mapped in the Belgian train stations. We hereby focus on travelers walking through stations with their bikes.
Elevators
Elevators are represented in OSM with a single node (most of the time) and the tag highway=elevator. The following overpass query https://overpass-turbo.eu/s/1pm1 gives 90 elevators that are strictly to and from the platforms. They are mostly found in the larger train stations. However, we noticed that some elevators were not identified by this query because they were slightly outside of the platform area. This should be corrected in most cases.

As it stands, I believe the need to rekindle the interest in volunteerism among members of the open mapping community is a necessary evil. This belief results from personal experience as well as other colleagues’ experiences. I joined the open mapping community through Youthmappers in 2016 and have been actively involved since then. Mapping has been fun and competitive since I joined the community. Thus, at the local chapter level, national and international levels, I have enjoyed a series of mapathons that were fun and competitive. A major event I can recall is the Malaria mapping challenge, where mappers from the University of Cape Coast were rewarded with some GPS devices at the end of the challenge to boost their mapping activities. Memories from the challenge put smiles on my face to this day. I can recall that some members of UCC Youthmappers were happy to answer a midnight call, trade sleep, and map to contribute to the malaria challenge and help the chapter compete as well.
I take a closer look at some of the local chapters in my home country these days and that zeal and interest seems to be dying off. That is a worry that needs attention, especially from the Gurus in the community. We have to encourage old members to share the positive impacts and personal experiences they have had so far with members who are losing interest to revitalize their interests.
Also, competitions should be enrolled more often and at all levels to be sure no one is left out. Finally, all members contributing every bit of data should be given some recognition so everyone feels involved. Let us keep the community running and keep the volunteering spirit moving!
Those before me who have mapped Lafayette have done well with regard to primary infrastructure, namely the roadways. But it seems many businesses and homes are missing. I’ve got my work cut out for me, for sure…

Introduction
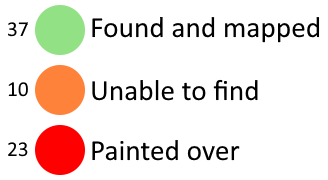
About 2 weeks ago I found San Francisco’s open data website, on it was this dataset containing 70 murals along with information about their artist and Cultural District. I used SF Mural Arts as a source for the names of some of the murals.
I’ve uploaded all the files I used for this project here. I used a spreadsheet to track my progress, the file is called “StreetSmArts_Murals_progress.ods”. You can find way IDs in column Q and notes in column S. This legend explains what each colour used in the spreadsheet means and how many murals belong in each category.
Tagging Schemes
There weren’t any tags for some of the information in this dataset so I came up with some new tags in the process.
Cultural Districts
Some of these murals are within certain Cultural Districts, which from what I’ve read on their websites are basically just a fancier version of neighborhoods that organize events to celebrate the culture of those within the district.
Hello!
I’ll be working on developing Python bindings for the OSRM project for GSoC this year.
I’m pretty excited to say the least, as mapping/navigational data is something that I find genuinely fascinating and important, but also because I’ll be able to learn about working on a project via hands-on experience - with guidance from some really nice mentors.
A little bit about me - I’m most comfortable writing C++ code, as it’s the language I have used the most by far. That said, I’m also interested in all things development related, so it’ll be a good opportunity for me to learn more about bindings and the Python side of things.
Mapping the Weinsberger Berge
Inspired by Tom7 to go outside more, I set myself the goal of biking every Forestpath between Weinsberg and Heilbronn, before I will be moving avay in the Summer.
In the process I stumbled across many Tracks that need updating. Many have overgrown to the point of unusability, others are not mapped yet. One of the biggest challenges for the Forest in my opinion is deciding which Harvester Tracks should be mapped and which not. On a normal Field you wouldnt map every Tracktor Track, but in the Forest these Paths sometimes turn into paths used by the public. They are pretty volatile though. In the tree felling season they look like high traffic Tracks, very compacted, traversible by normal Trucks. But they are also not maintained, so quick to overgrow and turn very muddy to barely passable with a bike after a few days of rain.
This weekend I was able to complete the 4th of my areas and I wanted to take stock. I have driven every Path between Donnbronner Landstraße, Heilbronn and L1111. This includes the Schweinsberg, the vineyards, Köpfertal and Büchelberg. I also drove every path in Weinsberger Tal and the Waldheide between Donnbronner Landstraße, A81 and the Verwaltungsgrenze Weinsberg in the South.

Spent Sunday going around many of the new housing estates around Congleton to survey roads, paths and house addresses. By my very rough count there have been over 3000 houses built or planned in Congleton since 2010 - this Overpass query shows the extent: https://overpass-turbo.eu/s/1pPW
On the 1st of June, 2023, I trained about 15 newbies who just joined our local chapter on how to map using the iD editor in osm.
2nd of June, we held a coordination meeting for SOTM Nigeria.
[post deleted]
Contrary to common practice, I hold (after much deliberation and consideration) that the best way to map runways is to make them an area.
One reason is that everybody and their dog, including our very own dearest wiki, defines a runway as being an area, with various elaboration. Example from our own wiki: [quote]A runway is a defined rectangular area on a land aerodrome (aeroway=aerodrome) prepared for the landing and take-off of aeroplanes. [/quote].
The eternal counter-argument is the parallelism to ways, railways, waterways and perhaps more; but I hold this argument to be non-valid. Unlike all the other categories, runways can NOT be joined to create routes. An aviator’s route planning mentions aerodromes and optionally other waypoints, navaids, visual reference points, but never runways. So that there is really no point in defining a runway as a way, or any other linear element.
I therefore strongly oppose both the mapping of runways as linear elements, and the additional use of area:runway or any such. The latter are totally redundant, and thus a waste of valuable resouces, storage capacity in the first place.
I am not the only mapper with this opinion, even less am I the first; many French ultralight terrains and their runways (“Base ULM”) have been mapped this way, and never been questioned. I find them perfectly satisfactory, too. For just one example among many, see [url] osm.org/way/587820283 [/url]
Posted by mikko_tamura on 2 June 2023 in English.

What is Hasiru Aqua & what do they do?
Hasiru Aqua, a leading agritech startup, is transforming the aquaculture landscape by providing vital support to farmers in Karnataka, India. Their efforts in increasing fish yields have significantly boosted farmers’ incomes and improved the overall socio-economic well-being of farming communities. Additionally, by incorporating fish into local diets, Hasiru Aqua is enhancing the health outcomes of individuals.

Why does Hasiru Aqua require mapping?
Hello everyone, myself Neelima Mohanty , currently pursuing my BTech in Computer Science and Engineering from Odisha University of Technology and Research , Bhubaneswar , Odisha , India. I am a Sophomore (2nd year) . I have been selected as an Outreachy intern at Humanitarian OpenStreetMap Team (HOTOSM) for the May to August Cohort.
My Core Values which motivated me to apply to Outreachy
* Learning and Implementation
Once Benjamin Franklin had said “Tell me and I forget, teach me and I may remember, involve me and I learn.” Almost all the tech skills that I have learnt till date have implementations tied along with them. My internships , trainings and small projects are all evidences of the fact that I believe in a continuous and comprehensive process of learning and implementation. I applied to Outreachy on the same ray of hope that each time I make a contribution I will learn something new and implement it.
* Transparency
Quoting the line of Dalai Lama “A lack of transparency results in distrust and a deep sense of insecurity.” I always like the workplaces which are transparent and where the process of judgement is crystal clear . Such a place is Outreachy and also the organisation I had applied for (HOTOSM) along with my mentors Petya Kangalova and Rob Savoye. The three steps of Outreachy Open Source program – initial application , contribution period with final application and the internship period shows how Outreachy follows transparency and this really impressed me.
* Teamwork
“Teamwork makes the dream work” said by Bang Gae. During the contribution period of Outreachy , I came across my amazing mentors Petya Kangalova and Rob Savoye who guided me along every step and are still guiding me. Talking to them I felt like if I get selected , we will form a great team together. And here I am with me dream fulfilled.
Last week, I became actively involved in Engineers Without Borders here in Norway, and a project that I was asked to engage with is “missing maps”.
Today, I attended a “mapathon” here in Oslo, I created my account here, and I made my first set of edits on this project: https://tasks.hotosm.org/projects/14389#description
I am starting out, but I hope that I can do some good work here in the future, and also invite others in as mappers, as well as organize my own “mapathon”.
Also hoping to join a community of mappers where we can exchange tips and tricks, and share best practices.
Best regards from Oslo, Raymond M. Kristiansen AKA “DLTQ”
Posted by pitscheplatsch on 1 June 2023 in English.

The OpenStreetMap (OSM) project has over 10 million registered members, with around 2 million user profiles having made at least one map contribution. However, a closer look reveals that there has been a slight decline in the number of active contributors over the last three years. Despite the extensive global mapping community, there are instances where individuals or automated bots disregard the consensus norms of the community when editing data. These situations arise due to disagreements regarding the appropriateness of certain tagging or features within the OSM database. To address these issues, a change rollback process, commonly referred to as reverting, is used to combat vandalism and correct ‘mistakes’ by restoring a previous version of the data.
Two years ago, I added additional statistics to the “How did you contribute to OSM?” page for quality assurance purposes. The numbers for each contributor profile were derived from an analysis of the full history OSM planet dump and changeset tags, including the specific editor used. While this pragmatic approach provides valuable insights, it’s important to acknowledge that the obtained numbers are estimations rather than exact figures. Furthermore, I received several inquiries regarding the implementation of the processing involved in identifying the displayed “reverted changes”.
Over the past few weeks, I have developed an advanced processing pipeline. This involved revisiting the comprehensive OSM planet dump and examining the evolution of each entity (node, way, relation) in relation to its previous states. Specifically, an entity with a higher version number was identified as a revert if it had the same latitude/longitude coordinates (for nodes), tags (key-value pairs), and/or members (for relations) as a previous version. In simpler terms, if a mapper changed “X” to “Y” and another mapper subsequently altered it back to “X”, it would be counted as a revert.