OpenStreetMap logo OpenStreetMap

Diary Entries in English

Recent diary entries

Revised Script for usage in macOS 12+ with zsh:

#!/bin/zsh
echo "Download"
wget -t0 -c "http://download.geofabrik.de/europe/andorra-latest.osm.pbf"
wget -t0 -c "http://download.geofabrik.de/europe/austria-latest.osm.pbf"
wget -t0 -c "http://download.geofabrik.de/europe/belgium-latest.osm.pbf"
wget -t0 -c "http://download.geofabrik.de/africa/canary-islands-latest.osm.pbf"
wget -t0 -c "http://download.geofabrik.de/europe/czech-republic-latest.osm.pbf"
wget -t0 -c "http://download.geofabrik.de/europe/denmark-latest.osm.pbf"

echo "Convert"
./osmconvert --drop-version andorra-latest.osm.pbf -o=andorra-latest.o5m
rm -rvf andorra-latest.osm.pbf
./osmconvert andorra-latest.o5m -o=merged.o5m
rm -rvf andorra-latest.o5m

for FILE in ./*.osm.pbf; do ./osmconvert --drop-version $FILE -o=$(basename $FILE .osm.pbf).o5m; ./osmconvert $(basename $FILE .osm.pbf).o5m merged.o5m -o=merged_cache.o5m; rm -rvf $(basename $FILE .osm.pbf).o5m; mv -v merged_cache.o5m merged.o5m; done

echo "splitter" 
## latest splitter Version r653 used
java -Xmx5G -jar splitter-r653/splitter.jar --output-dir=tiles --max-nodes=1200000 merged.o5m

echo "mkgmap"
## latest mkgmap Version r4910 used
## template 2022pn.typ used, use what you like :)
java -Xmx5G -jar mkgmap-r4910/mkgmap.jar --country-name=OSMMap --family-name="OSM map" --product-version=1 --bounds=bounds-latest --dem-interpolation=auto --make-poi-index --poi-address --unicode --index --split-name-index --gmapsupp --report-routing-islands -c mkgmap-r4910/examples/sample.cfg -c tiles/template.args 2022pn.typ --style-file=../ --check-styles --route --net --gmapi --add-boundary-nodes-at-admin-boundaries

echo "final clean up"
rm -rvf *latest.o5m
rm merged.o5m
cd tiles
rm -rvf *.osm.pbf
cd ..
rm -rvf 6*.img 
rm -rvf ovm_6*.img

echo "The End"

Tree mapping is a task that is better done in person than using aerial imagery, unless it is a tree row. The reasoning being that node placement of natural=tree is more precise than looking from above, since more often than not the imagery is not that clear.

Trees tell a story

When looking at this area it is fascinating how one can make out man made structures relative to the placement of trees.

trees and tree rows as nodes and ways in JOSM

Further once adding the leaf_cycle and leaf_type one can create shade maps that could be practical during heat waves like at mapasdesombra.org or if jveuxdusoleil.fr extended its algorithm to include tree details as well.

One can add the tree’s height and diameter with a check date to create a timeline of the tree’s lifespan, though also add more potential data points in ecological terms.

Or one can add the genus and/or species to ease the search for foragers like mundraub does with their overlay map.

Tree specification

See full entry

Posted by qeef on 3 September 2023 in English.

The damn deploy repository of the Divide and map. Now. has been refactored. And that’s a great opportunity for another round of load testing.

This is the third round of load testing, see the first and the second one if you are interested.

The load testing is a bit different from the last time. I performed load testing of new, freshly deployed damn project instance on $6/month VPS with 1 GB RAM, single 2.5 GHz vCPU, and 25 GB SSD. (The changes from the last time are that there is no more load testing of the “production” server, the price increased by $1/month, and shared_buffers is now 256 MB instead of 409 MB.)

The preparation for load testing on the server’s side, when the damn project is deployed, is just to run

docker-compose -f damn-deploy/gen.yml run --rm prepareloadtest

to create 1000 test users and 10 (load) testing areas in the database. For each run of load testing, the database has been deleted and created again with

systemctl stop damn-http.service
reboot
docker volume rm damn-deploy_damndb-volume
systemctl start damn.target
docker-compose -f damn-deploy/gen.yml run --rm prepareloadtest

commands. For each run of load testing, log the server’s utilization with

sar -o load-test-100 -A 15 $((4 * 61)) 1>/dev/null 2>&1

Then, from that file, you can generate data series and plot the graphs with

./get-info.sh 100
gnuplot plot1.pl
gnuplot plot2.pl

where the content of the corresponding files is

get-info.sh:

See full entry

Posted by scruss on 3 September 2023 in English.

… unless you want a greatbighuge label inexplicably hovering over the map at z=16.

Looking over this fine city of Toronto, I saw a couple of brown labels for places that are sort-of not real. Exporting and grepping local exports showed me they were landuse ways with a name value set.

I’m sure there are plenty of good examples where a landuse area would have a name. In these cases, though:

  • one was the name of a city/developer study from roughly five years ago that has disappeared from the record since then. Will it become a neighbourhood name? Who knows, but that’s for the future and not for us to force. (fun fact: it’s apparently the densest concentration of office workers in the city. Less fun but very Toronto fact: there is no dedicated transit there. I had a job there ~2006–2008 and new transit was planned, but then the trainwreck formerly known as Mayor Rob Ford happened so it didn’t.)

  • one was a drive-by tagging error by an out-of-band specialist. I really think they meant it for a bus stop.

Aligned with my personal policy of “Only kvetch after fixing”, they’re gone and our z=16 will be so much less jarring. Thank me later.

Posted by pnorman on 1 September 2023 in English.

The Standard Tile Layer has a lot of traffic. On August 1st, a typical day, it had 2.8 billion requests served by Fastly, about 32 thousand a second. The challenges of scaling to this size are documented elsewhere, and we handle the traffic reliably, but something we don’t often talk about is the logging. In some cases, you could log a random sample of requests but that comes with downsides like obscuring low frequency events, and preventing some kinds of log analysis. Critically, we publish data that depends on logging all requests.

We query our logs with Athena, a hosted version of Presto, a SQL engine that, among features, can query files on an object store like S3. Automated queries are run with tilelog, which publishes files daily to generate published files on usage of the standard tile layer.

As you might imagine, 2.8 billion requests is a lot of log data. Fastly offers a number of logging options, and we publish compressed CSV logs to Amazon S3. These logs are large, and suffer a few problems for long-term use because they:

  1. contain personal information like request details and IPs, that, although essential for running the service, cannot be retained forever;
  2. contain invalid requests, making analysis more difficult;
  3. are large, being 136 GB/day; and
  4. become slow to query, being compressed gzip files with the only indexing being the date and hour of the request, which is part of the file path.

To solve these problems we reformat, filter, and aggregate logs which lets us delete old logs. We’ve done the first two for some time, and are now doing the third.

See full entry

Posted by Heather Leson on 31 August 2023 in English.

How do we better organize to support the Humanitarian OpenStreetMap Team organization, staff, membership, and community? We have been on a journey to open up and consider what is the best way forward for HOT’s Governance. Now that we have the HOT Living Strategy, we have more incentive to imagine how we might evolve. We are taking stock of our governance and investigating how we might be able to encourage more people to engage in the governance of HOT.

The HOT Governance Working Group (GWG) started the process of research and engagement with the HOT membership in January 2023. We’ve documented this process in the GWG meeting minutes. Together we designed a terms of reference to hire support to help us research some initial bylaw adjustments and wider organizational needs and structures.

Our first big research is exploring how we govern with the board and to better support the membership chair. There will be future steps and research to consider the role of the membership and how we collaborate with the Open Mapping Hubs.

The board and membership asked us to consider the following topics: the possibility of appointed board members, board member stipends, and membership chair term. See the current HOT bylaws

Why the proposed changes

The HOT voting members have a wide range of skills, and have brought much insight and change to the organization. Currently, HOT’s board is elected from and by the voting membership. Over the past years, HOT board and organization have identified gaps in key expertise for the board, including legal, finance and large-scale fundraising. This has been documented in various OSM diary posts, the HOT board election discussions, and the Board and GWG meeting minutes.

See full entry

Location: Kemptville, North Grenville, Leeds and Grenville Counties, Eastern Ontario, Ontario, K0G 1J0, Canada

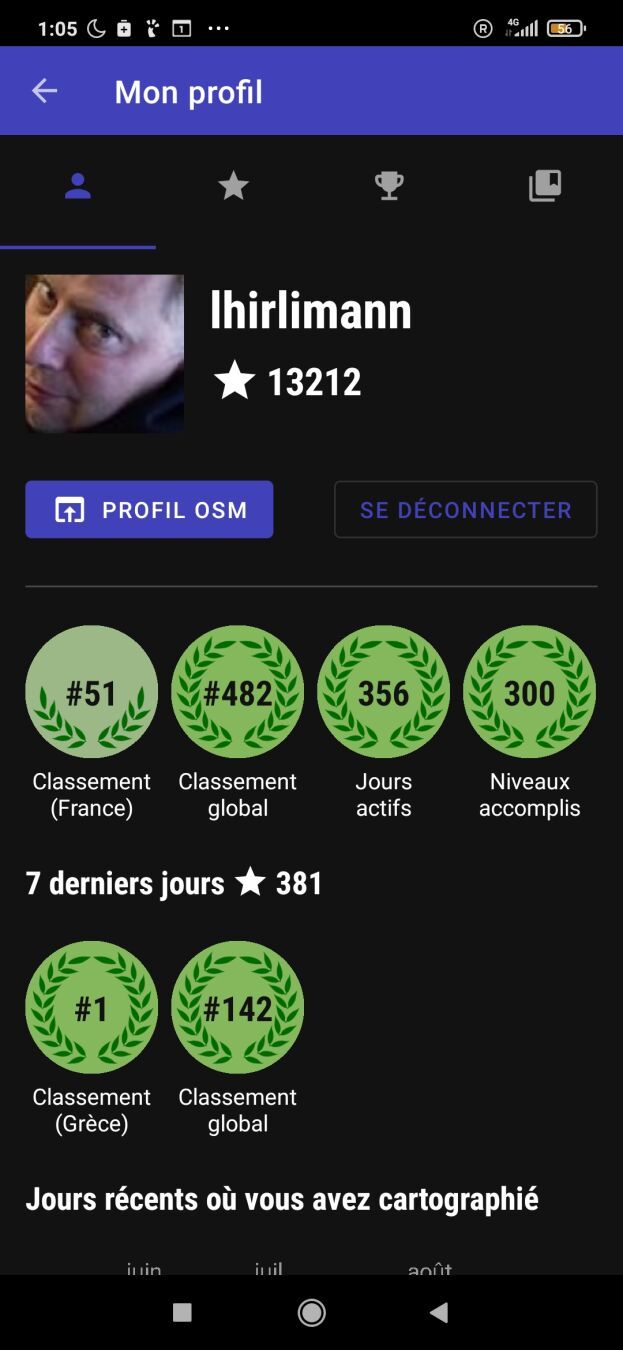
Last week I had a week of vacation in beautiful Greece. As I needed to do some kind of daily exercise, I decided to walk and played with streetcomplete. I’ve been off the app for a few months due to lack of motivation. After one hour of going around and adding things I looked at my profile and was #1 on Greece what a shock. Screenshot of my streetcomplete profile showing me being number 1 in Greece after 3 days

Wondering how that could be?

  • Are all greeks using iphone? (I doubt)
  • Is no one using OSM in Greece? (I doubt)
  • Is Streetcomplete missing some greek translation (probably, I didn’t check).
  • Am I the only one doing streetcomplete while on vacation?
Location: Kato Spileo, Agios Dimitrios, Municipal Unit of Meliteieis, Municipality of Southern Corfu, Corfu Regional Unit, Ioanian Islands, Peloponnese, Western Greece and the Ionian, 490 80, Greece

OSM에는 왜 이렇게 흐릿한 갈래가 많을까……

외국 사람들에게 한국의 ‘곰’, ‘탕’, ‘국’을 갈래지으려면 갈래지을 수 있을까?

도대체가 말이 안 되는 짓거리를 언제까지 하고 있을 건가…… ㅡ.ㅡ


Why does OSM have so many fuzzy branches……

Is it really possible to make Korean ‘gom’, ‘tang’, and ‘guk’ forked for foreigners?

How long are we going to keep doing this nonsense…… ㅡ.ㅡ

Hello! Today, I want to share a handy script that can enhance your experience with JOSM on MacOS by enabling a dark mode theme. Dark mode not only looks sleek but can also reduce eye strain, especially during late-night mapping sessions.

Note: This script is specifically for MacOS users.

Step 1: Download JOSM

If you haven’t already, download the latest version of josm-tested.jar here. Save it to a location on your Mac.

Step 2: Install the FlatLaf Plugin

FlatLaf is a fantastic plugin that allows you to apply dark themes to Java applications. After installing the plugin and restarting, go to the menu and select the dark theme: JOSM → Settings → Display → Look and Feel → FlatLaf Darcula

Step 3: Create and Run the Script

Now, let’s create a script that will launch JOSM with a dark theme. Open your favorite text editor and paste the following code:

shell #!/bin/zsh

java -Dapple.awt.application.appearance=NSAppearanceNameDarkAqua -Xmx7168m -jar /Users/YourUsername/Documents/josm-tested.jar

Make sure to replace YourUsername with your actual MacOS username. This script does the following:

  • #!/bin/zsh: Informs your system to use the Zsh shell to execute the script.
  • java -Dapple.awt.application.appearance=NSAppearanceNameDarkAqua -Xmx7168m -jar /Users/YourUsername/Documents/josm-tested.jar: Launches the Java runtime with dark mode enabled, allocates 7168MB (or 7GB) of RAM to JOSM (you can adjust this value), and specifies the path to your JOSM JAR file.

Step 4: Save and Make the Script Executable

Save this script with a .command extension, for example, josm-dark-mode.command. To make it executable, open your terminal, navigate to the directory where you saved the script, and run the following command:

shell chmod +x josm-dark-mode.command

Step 5: Execute the Script

Now, you can simply double-click josm-dark-mode.command, and JOSM will launch with a beautiful dark theme, thanks to the FlatLaf plugin and the MacOS appearance setting.

See full entry

Location: Cape Town Ward 115, Cape Town, City of Cape Town, Western Cape, South Africa

Introduction

Hi everyone, this is my final report for my GSoC’23 project: support Vespucci preset extensions in JOSM.

Previous diary entries

Getting started

Project Summary

About the project

Vespucci utilizes the JOSM preset format but has extended the configuration to work better outside of the narrow realm of JOSM. The project aimed at adding these additional extensions in JOSM. These extensions include deprecated, regions, exclude_regions, value_type, and alternative. see Vespucci preset documentation

Work done

The presets can have the additional attribute “regions”, which will contain the ISO codes of the countries to which the preset is applicable. “exclude_regions” will invert the meaning of “regions”, i.e., the preset should not be applied in countries specified under “regions”.

A warning message is displayed before the upload if the preset is applied in the country not defined in the “regions”.

See full entry

Posted by barefootstache on 27 August 2023 in English.

It has been just over a week that I have accomplished the 365 daily MappingChallenge (Mastodon) and decided to persist with a 100 weekly challenge instead. One of the main (Mastodon) reasons is how daily contributions are being processed based off of UTC+0, which is manageable if one does not travel. Further this week I have decided to use the OSM Diary over Mastodon, since this way I can do long form entries with less constraints and possibly reach a larger audience.

Quick overview

In week 54:

  • 34 change sets created in total
  • 5327 node changes in total

all were done within JOSM.

Changes

  • extracting sidewalks from roads
  • splitting up schools
  • adding roof shape and roof material

Puchheim Realschule and Gymnasium

Location

Before and after animation of building geometry changes of a school district

Puchheim Mittelschule and Grundschule

Location

See full entry

Posted by b-unicycling on 27 August 2023 in English.

Heritage Week is an annual number of days (it’s longer than a week by now) taking place in August in Ireland. There is a wide array of events including talks, workshops, guided walks etc all around built and natural heritage. This year’s topic was “Living Heritage”.

Recording Milk Churn Stands

Early on in my effort to map milk churn stands in Ireland, I thought that it was not sustainable for me to travel around the country and look for the needle in the haystack, when the locals knew where all the milk churn stands were. So I decided to give a talk which would hopefully raise awareness about the endless possibilities OpenData, OpenSource and OpenStreetMap offers. It was supposed to be a workshop, but I had a funny feeling that the demographic of the audience would turn it into a talk. It actually turned out to be the first event on the Heritage Week website. The Minister for Heritage (, Housing & Electoral Reford) who I happen to be friends with offered to attend, and of course I thought that would be a great opportunity to promote OSM.

The venue was a library in a rural town which used to have a creamery, because I thought it might attract people who remembered the time when milk churn stands (aka creamery stands) were still in use. Once the librarians heard that the minister was attending, they got a bit excited and let the regional library manager know. The big day arrived on August 16th, and he did attend. I had brought the OSM Ireland pull-up poster for the photo op, and also for branding awareness reasons. - So many people still don’t know about OSM, even though everyone by now must have been exposed to it one way or another.

See full entry

Location: Talbotsinch, Kilkenny Rural, Kilkenny, County Kilkenny, Leinster, R95 P96W, Ireland
Posted by miku0 on 27 August 2023 in English. Last updated on 29 August 2023.

Hi everyone,

I am thrilled to present the final updates on my ongoing project focused on enhancing the search experience in Japan. For reference, you can find the previous blog entry here and the interim report here. In the last interim report, I introduced the changes related to the sanitizer. The associated pull requests for these changes can be accessed here. Regarding this article, you can find the pull request for this specific change here.

In this final update, I will provide detailed insights into our efforts in the “Address Search” realm, specifically related to the tokenizer.

Enhancements in Address Search Methods in Japanese

Japanese Addresses are written in one large string without spaces and Nominatim needs help to find the words. As an illustration, for instance, consider the Japanese address “東京都新宿区西新宿2丁目8−1”. Although it lacks spaces, it can be divided into internal segments such as “東京都” (similar to a state or district), “新宿区” (akin to a city), “西新宿” (akin to a town), and “2丁目” (a block). However, Nominatim only divides such addresses using ICU (International Components for Unicode) transliteration, not based on this semantic division. Fig.1 illustrates a debugging example with multiple potential candidates.

See full entry

Project name: Guidelines for mapping of wetlands and floodzones. Case study of Lower Sinu river basin in Caribean region of Colombia

Description

The goal of the project is to test the mapping case study to build a document with guidelines for mapping in this areas. It comes from the experience of the “Water telling stories” Social Movement, a root social initiative of near 47 communities, grassroots organizations from 5 municipalities around the ecosystem of the Lower Sinu River Basin, located in the north coastal side of the Cordoba Department, in the Caribean region of Colombia. As part of the technical support team of the movement, Iḿ leading the mapping project for this area.

More info:

I used the jamboard to put one the difficulties from my side:

“I can’t find allies for my legacy project from my OSM local and regional Community. I need people to help me to identify the needs of mapping wetlands and flood areas.”

I’m working with one volunteer from Youth mappers in Colombia who is interested in help to this mapping project. As I said in my diary entry, previously I had lead one mapping session to invite people to join our tasking manager mapping task to map Bajo Sinu “Lower Sinu River basin”.

In my action plan I have:

See full entry

Location: Lorica, Bajo Sínú, Córdoba, Colombia
Posted by Midnightlightning on 26 August 2023 in English.

I found myself down a rabbit hole searching for a good tool for a specific use-case today. The use case is trying to send someone a link to a specific geographic area. My use-case was for directing another person to a specific meetup spot (“meet me over here by the northeast corner of the parking lot”), which doesn’t need to be a point but could be something like a 10x10 foot square and still get the point across. Additionally, there’s a use-case for it in leaving “map notes” within the OSM system: some notes need to indicate very precisely “there’s a missing feature RIGHT HERE”, but others could be more general (“this area is a forest”), and if the note could be tied to a zone, that could be more helpful.

I have used what3words in the past for this, and that site has a nice, short URI scheme to share with people, but the map layers don’t include OSM options, so I started looking for ways to combine the two. That lead me to the wiki page that highlighted many shortcomings with that system (as it’s a centralized, copywritten service). So I went hunting for other systems that could fill the same need of sending people a nice link to “meet me here” (small area) or “I live here” (building-sized area), with OSM tile data under it.

Of the many options for “geohash”-style approximations of latitude/longitude, it seems “Plus Codes” (formerly “Open Location Codes”, OLC) have gained traction as a way to refer to small and large geographic areas, but the main https://plus.codes/map site (the key one that allows seeing a visualization of the grid system, so you know how big a region you’re referring to) only uses Google Maps tiles as the underlying visual, so aesthetically is the same as what3words (telling someone “meet me at the corner of the parking lot here:” with https://plus.codes/86MG4JJJ+HHR is essentially the same experience as giving them https://w3w.co/handy.lame.treats).

See full entry