Deiboek fan Alexander Avtanski
Deiboekstikken fan koartby
GPSMash update - Support for NMEA import, data cleanup updates
Pleatst troch Alexander Avtanski op 5 augustus 2013 yn it English.Hello,
I just finished testing the latest update (1.3) of my GPS logfile handling tool GPSMash. The new features in version 1.3 are:
- import of NMEA logfiles
- improved track cleanup algorithm
GPSMash is a command-line Windows application that can repair broken GPX files, clean-up, organize, and analyze data, convert to various formats for visualization, etc.
Here is a sample video using data processed with GPSMash:
Click to play video: http://youtu.be/hAvHgBFEOAc
If you are interested, you can download it from my site:
Any feedback is welcome.
Regards,
Alex
GPS track processing tool
Pleatst troch Alexander Avtanski op 15 juny 2013 yn it English. Lêst bywurke op 16 juny 2013.Hello,
I’ve been working on a GPS track visualization and processing tool - GPSMash - for a while and today I just completed the first release suitable for public use (most bugs fixed, enough functionality, good documentation). This is a command-line Windows application that can repair broken GPX files, clean-up, organize, and analyze data, convert to various formats for visualization, etc.
Here is a sample video using data processed with GPSMash:
Click to play video: http://youtu.be/hAvHgBFEOAc
If you are interested, you can download it from my site:
Any feedback is welcome.
Regards,
Alex
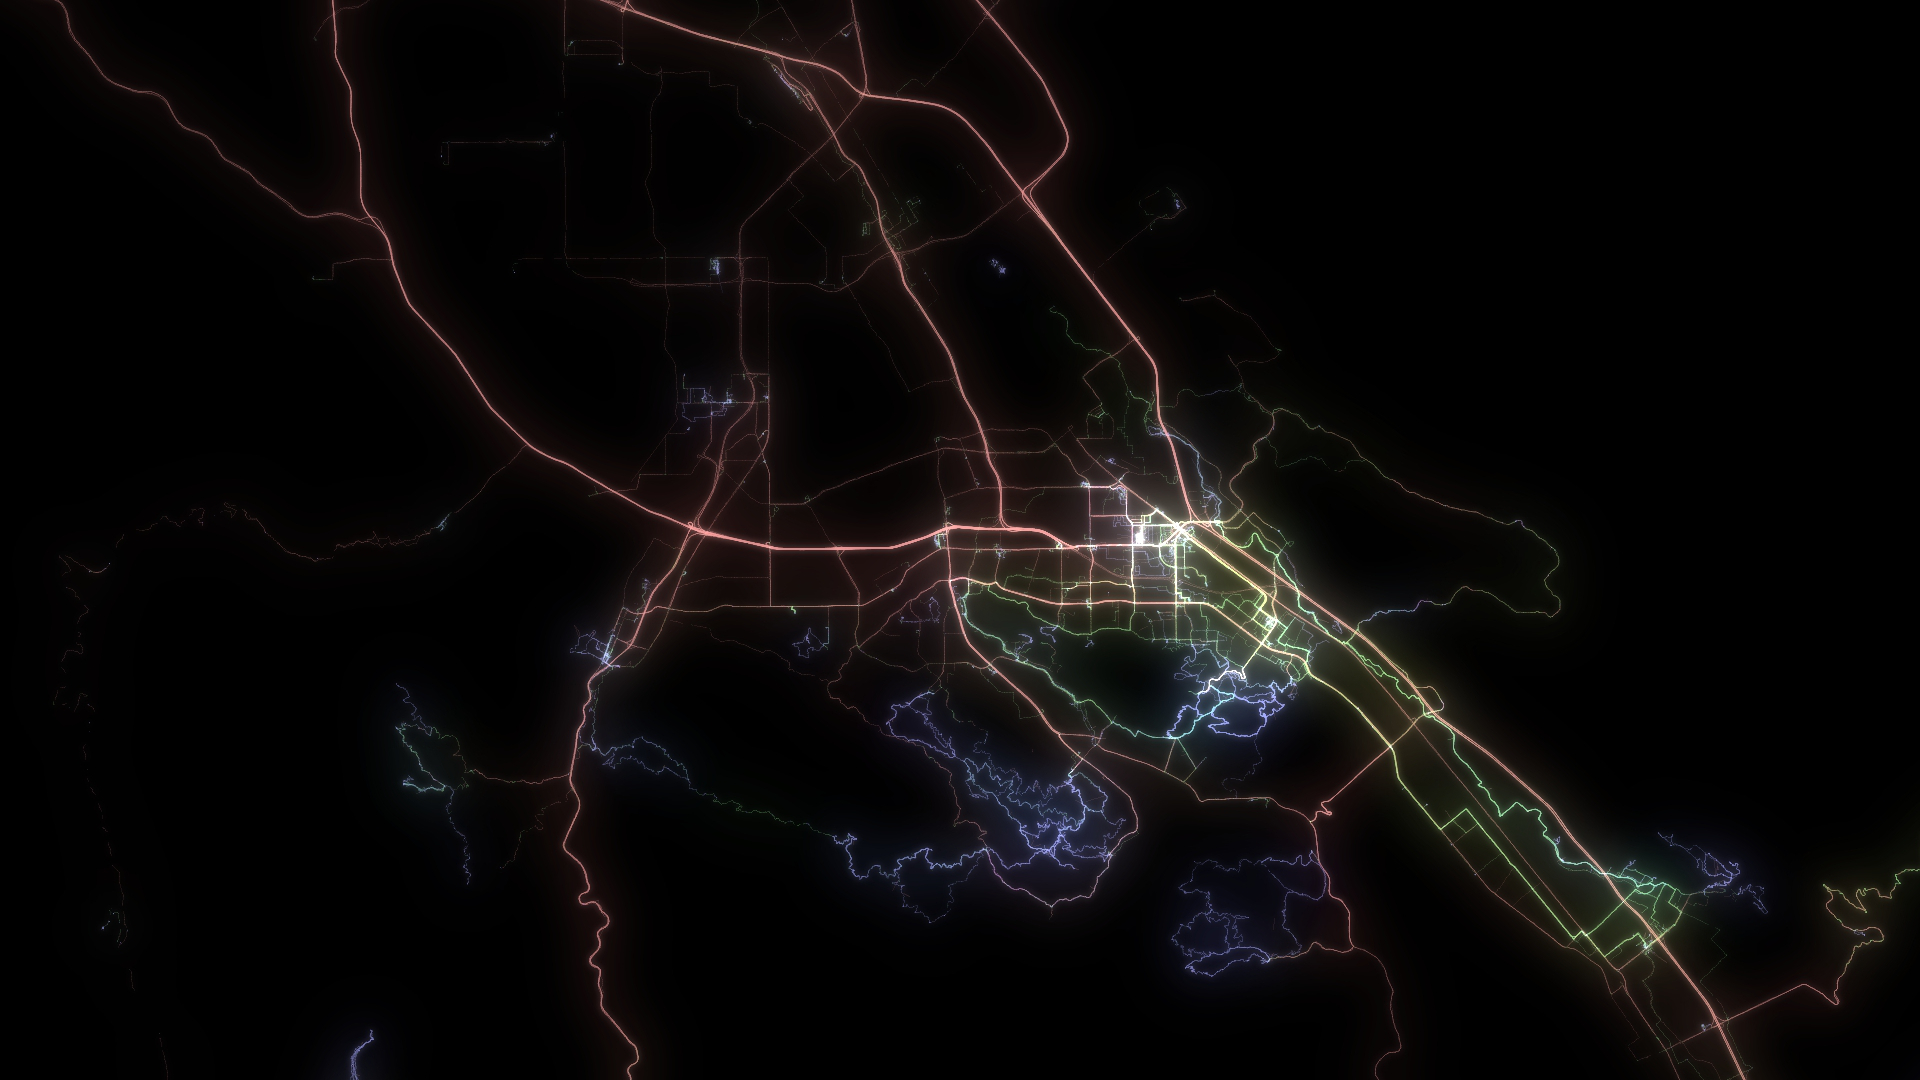
Today I put together one year worth of GPS tracks from my lunch walks and bike rides around the office. The colors correspond to different speeds - yellow is for walking, magenta is for biking and cyan - driving at highway speeds:
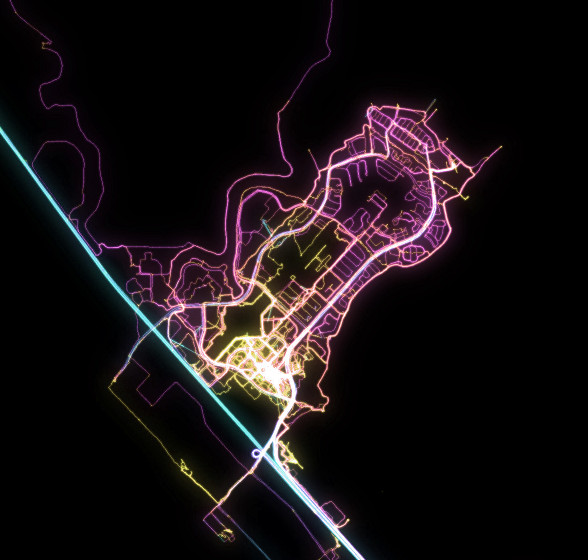
In case you feel offended by the bright neon colors, here is another version (blue = walking, green = biking, red = driving):
I'm in the habit of always carrying my GPS, recording where I go hiking, biking, or driving. Yesterday, while on a walk, I though that it should be pretty easy when visualizing the accumulated track to use different color for each mode of transportation. So, today I modified my GPS visualizer scripts a bit, adding parameters that allow selection by speed range.
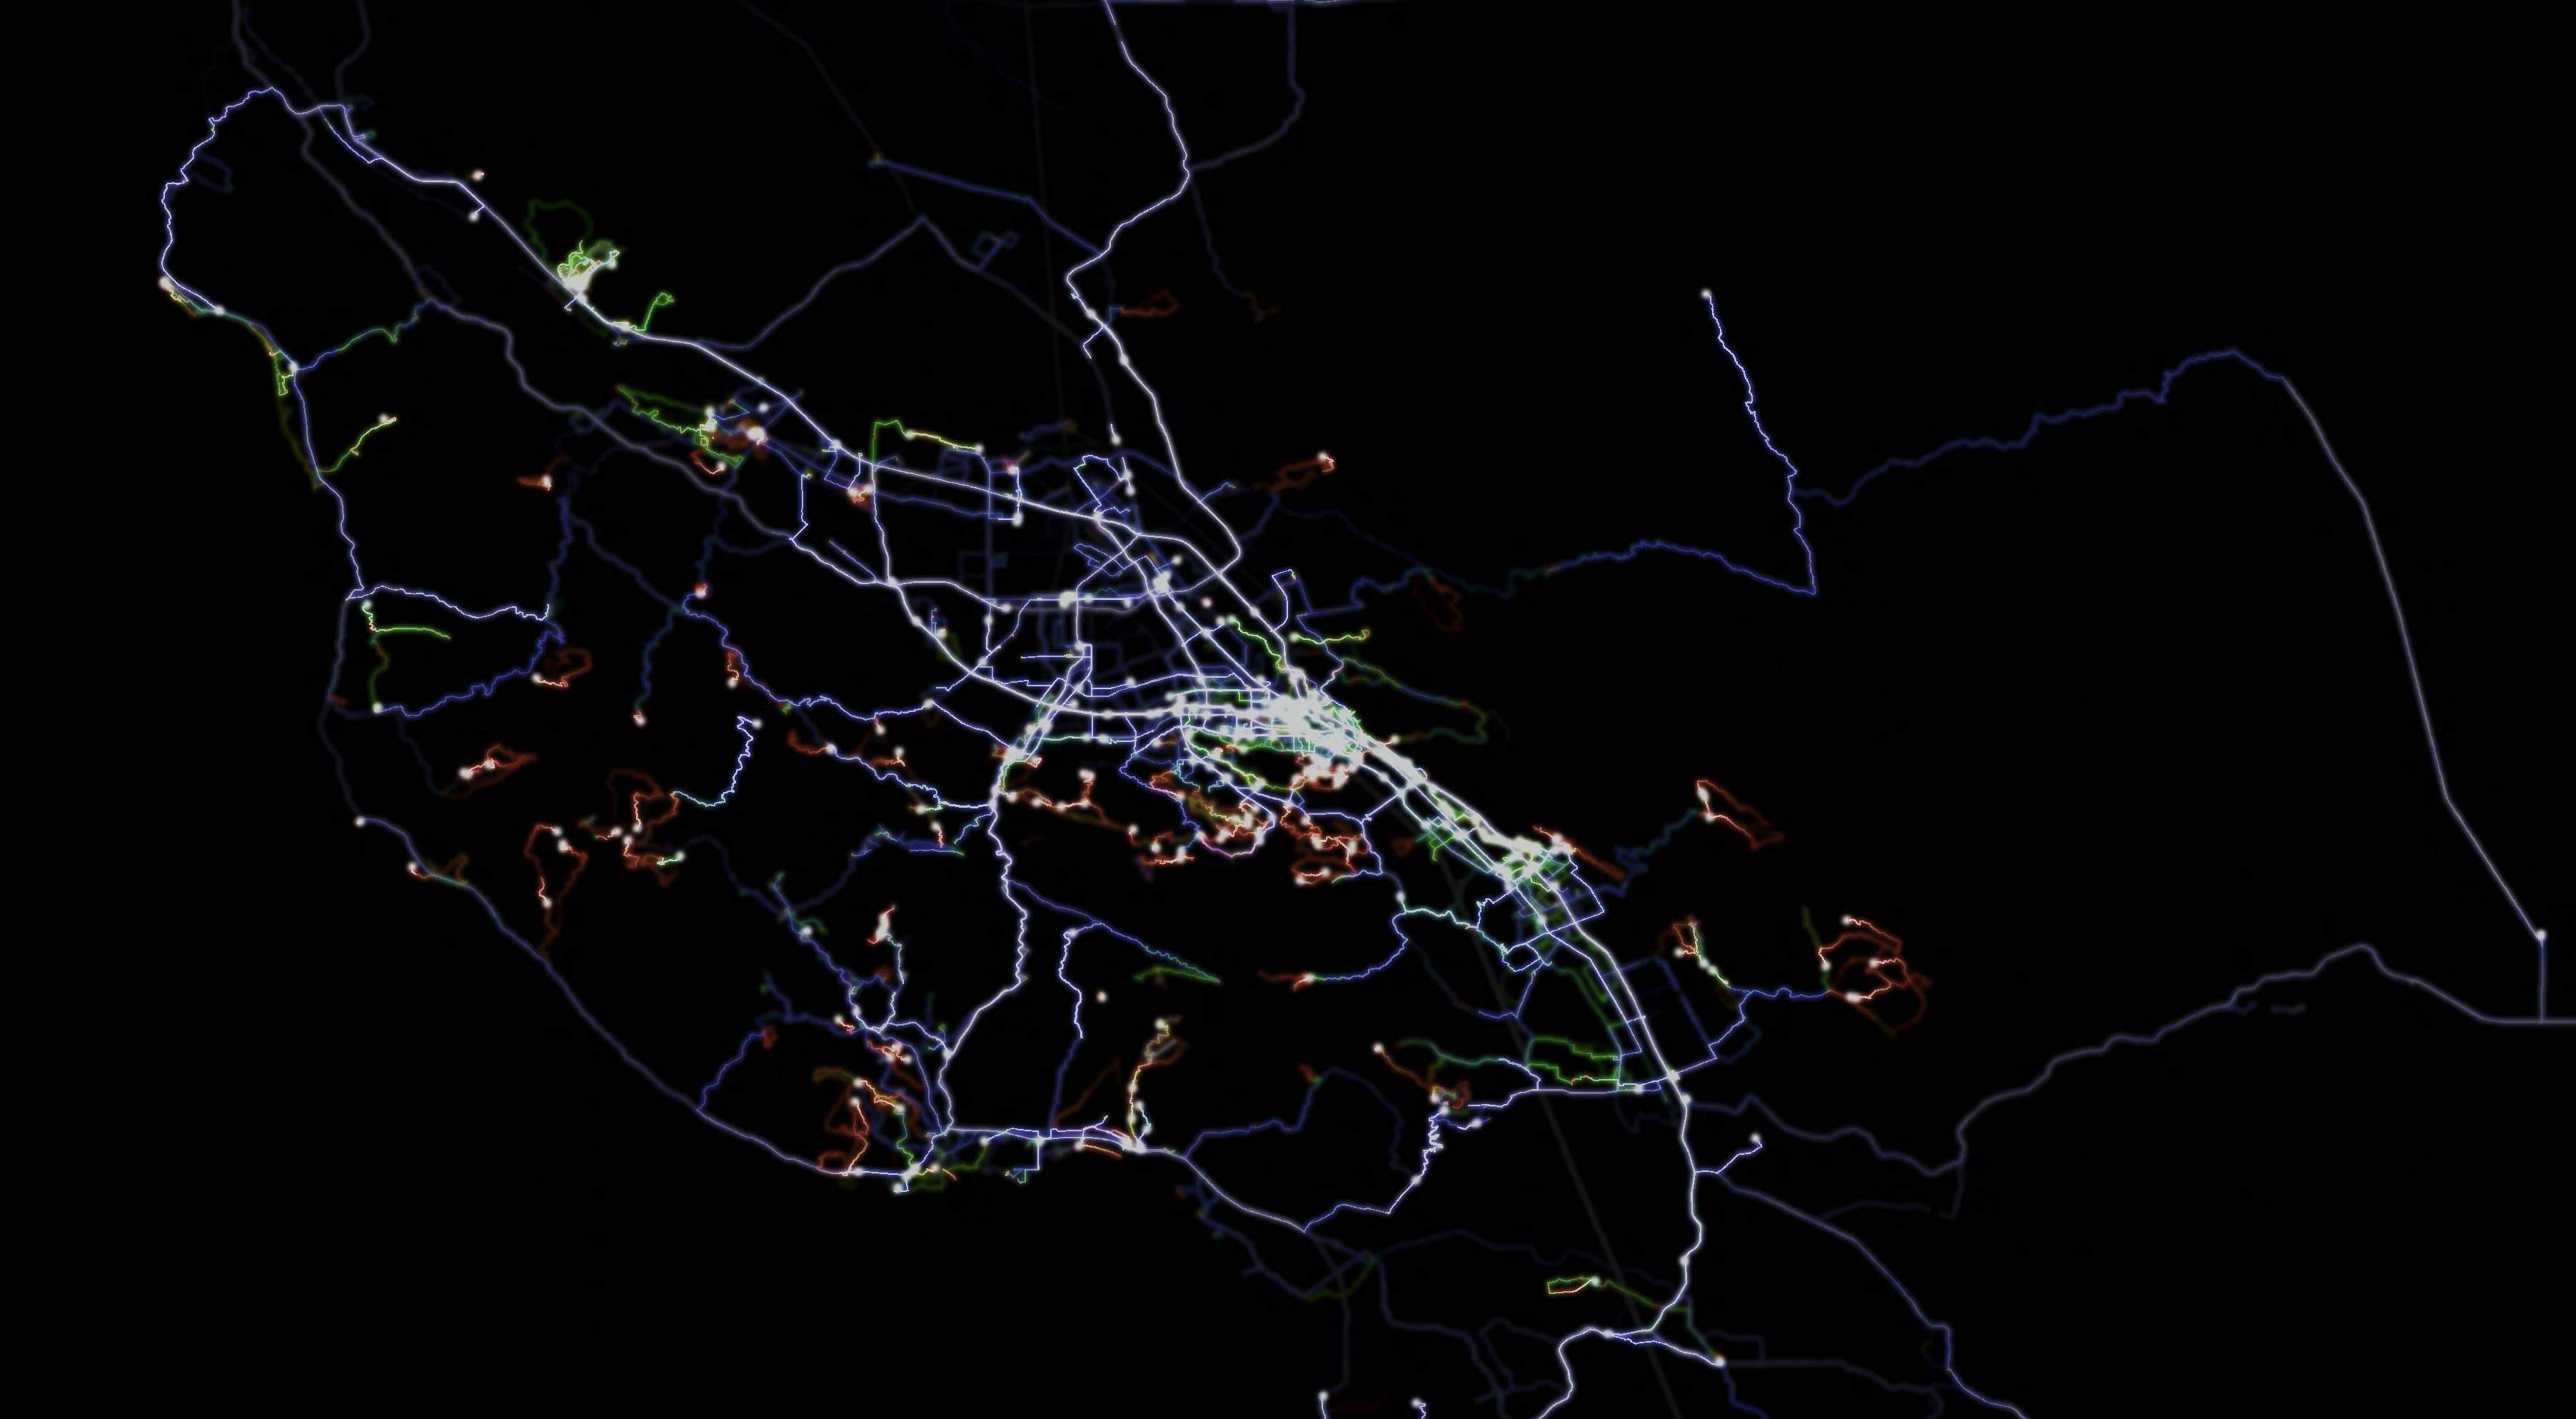
On this image my trips are color-coded, based on the track speed:
Here RED is Driving (or rather "likely driving" based on the speed range), GREEN is Biking, and BLUE is Hiking/Walking.
If somebody is interested, the visualizer scripts, some more images, and a sample video can be downloaded from here:
http://avtanski.net/projects/gps .