Since last weekend, I was trying to make Kannada maps. To give a shot, I chose Chamarajanagar district, Karnataka. The data is from OpenStreetMap and SRTM.
Here are some of the output in different styles:

… 모든 항목 보기

Since last weekend, I was trying to make Kannada maps. To give a shot, I chose Chamarajanagar district, Karnataka. The data is from OpenStreetMap and SRTM.
Here are some of the output in different styles:
… 모든 항목 보기
You can plot simple Stamen map (© OpenStreetMap contributors) in R using below steps:
install.packages("sf")
install.packages("ggplot2")
install.packages("ggmap")
Once you installed, do load them using below code:
library(sf)
library(ggmap)
Next go to Geofabrik Tile calculator and copy the desired location co-ordinates.
Example: I copied Bengaluru co-ordinates using Coordinate Display tab under Osmosis copy and stored in bengaluruCoords like below:
bengaluruCoords <- c(left=77.17, bottom=12.59, right=78.05, top=13.34)
Finally run below code to generate map tiles:
get_stamenmap(bengaluruCoords, maptype = "terrain") %>% ggmap()
Here is the output:

Happy mapping & coding!

OpenStreetMap India community is excited to announce and host State of the Map Asia 2018 in Bengaluru on November 17-18. This is the 4th annual Asia OSM conference and we are thrilled to welcome OpenSteetMap community and share their amazing journey. Do check for interesting keynotes, talks and workshops in program schedule.
This event is open to everyone, even if you are not speaking at the session :)
… 모든 항목 보기
OpenStreetMap evolved since many years. Millions of contributors are helping this project to grow everyday. Inspired by some of my friends, Karnataka and Ireland evolution projects, I wanted to vizualize different parts of the world.
Sharing simple animated GIF that I created using Mapolution on Docker on my Mac showing different countries’ OSM edits over years. The snapshots are taken for every 30 days from the starting date.
 Sri Lanka (January 2015 - July 2018)
… 모든 항목 보기
Recently, Microsoft released 125 million US building footprints as open data across 50 states. The data is freely available for download and use. You can read about previous release of 9.8 million buildings here.
With the help of tippecanoe and Mapbox Studio, I have visualized Hawaii dataset to know how data looks like.
… 모든 항목 보기
Mapbox recently rolled out new satellite imagery for many places around the globe. I’m happy to share that some of the Indian cities also got new imagery with this update and the community can use this for mapping in OpenStreetMap. I always prefer best imagery to add highways and buildings the most.
 Bengaluru, Karnataka
… 모든 항목 보기

Hello all, Namasthe! 🙏 We had an amazing HOT Mapathon on July 21st at Mapbox India office. We had the local OSM community along with folks who were mapping for the first time adding approximately 3000 buildings in Cambodia for Eliminate Malaria task.
… 모든 항목 보기

ಕನ್ನಡ ನಾಡು ಕಂಡ ಮೇರು ನಟ, ನಟಸಾರ್ವಭೌಮ ಡಾ. ರಾಜ್ ಕುಮಾರ್ https://en.wikipedia.org/wiki/Rajkumar_(actor) ಅವರ ಸ್ಮಾರಕವನ್ನು ಈಗ ಎಲ್ಲರೂ ಮ್ಯಾಪಿಲರಿಯ ಮೂಲಕ ಕುಂತಲ್ಲೆ ವಿಕ್ಷಿಸಬಹುದು. ಕನ್ನಡ ನಾಡು ನುಡಿ ಮತ್ತು ಚಿತ್ರರಂಗಕ್ಕೆ ಅವರ ಕೊಡುಗೆ ಅಪಾರ. ಚಿತ್ರರಂಗದಲ್ಲಿನ ಜೀವಮಾನದ ಸಾಧನೆಗಾಗಿ ಭಾರತ ಸರ್ಕಾರವು ಚಿತ್ರರಂಗದ ಅತಿ ದೊಡ್ಡ ದಾದಾಸಾಹೇಬ್ ಫಾಲ್ಕೆ ಪ್ರಶಸ್ತಿ ಯನ್ನು ನೀಡಿತು. ಇತ್ತೀಚೆಗೆ ಗೂಗಲ್ ಇಂಡಿಯಾ ಅವರನ್ನು ಗೂಗಲ್ ಡೂಡಲ್ ಮೂಲಕ ಗೌರವಿಸಿತು.
… 모든 항목 보기
Microsoft recently released 9.8 million building footprint data of 102 cities covering 44 US states to the OpenStreetMap community. This is a huge boost to improve the building data in many parts of the United States. Right now, we have ~ 19 million buildings already added by the community through imagery tracing and imports.
The most exciting part of this data is that all the footprints have height information. That means we can generate simple 3D buildings. I downloaded all the data and created a Mapbox style with 3D extrusion:
Philadelphia (click here see the web map)
Boston (click here see the web map)
Baltimore (click here see the web map)
In general, the data is of good quality and will improve the building coverage in the US by 150%. But the quality may vary from city to city. Local mappers should evaluate each city before deciding to import.
Feel free to play with data, post your findings or screenshots of the data evaluation for the city you are interested in and let the community know how valuable this data is going to be for OpenStreetMap.
Code and step is available in Github repo: https://github.com/osmlab/ms-building-import/
* California not included in the tileset since OSM has fairly good coverage
Last weekend, I tried modelling San Francisco City Hall in S3DB. The public building has 100 years of glorious history. The diameter of the central dome is around 34 m and total height of the building is 93 m.
 From Wikipedia
The co-ordinates of the building is 37.77910°N/122.41937°W. Edited this model first through OSM Sandbox and copied all the geometries and tags to main OSM database. I used JOSM current version and Kendzi3D plugin to visualise locally.
… 모든 항목 보기
In 2016, San Francisco city Government published LiDAR-derived building footprints that include both geometry and height information. One of the main goals of the San Francisco OpenStreetMap community was to import this height data to the existing buildings in OpenStreetMap. The project was initiated by SF community in November 2016, recently Brandon and Daniel lead a great Mapathon at Mapbox SF office.

Together with the community, Mapbox data team remotely joined and imported nearly 140,000 building heights to OpenStreetMap. Now we can get a real world like experience using popular 3D renderers like OSM Buildings and Mapbox GL JS or create realistic city using Blender or style buildings using Unity. Cheers to the all of them who made this project successful!
… 모든 항목 보기
Maptime SF/MaptimeOAK and Mapbox SF are hosting a Mapathon on March 14th, Tuesday at 6:30 pm PST to import building heights. Please RSVP to SF OpenStreetMap Community to be a part of this awesome project.
 Image from Wikipedia
San Francisco has building footprints, Points of Interest, and traffic signals for the entire city in OpenStreetMap. All these map features makes San Francisco as one of the well mapped cities on OpenStreetMap. In 2016, the San Francisco city Government published LiDAR-derived building footprints that include both geometry and height information. One of the goals of the SF OpenStreetMap community is to add height information to existing buildings in OpenStreetMap.
To jump in quickly into the project, do check the OpenStreetMap wiki to know more and talk to the community on Gitter to get involved. Also, make sure to create a dedicated OSM import account before jumping into the task and post it here.
… 모든 항목 보기
This changeset look suspicious where a user added lot of point’s of interest like amenity=coffee, and amenity=beauty shops in Mexico city, Mexico. The user used Maps.me editor to add data.

My colleague @upendrakarukonda has left a comment on the changeset 3 months ago and removed only coffee shops. Again, I’ve commented for the second time on another changeset. We didn’t observe any reply from the mapper since. So sharing here with the community to examine beauty care places and take necessary actions.
Thank you
The SF Bay area community is trying to import height data for buildings in the city of San Francisco.
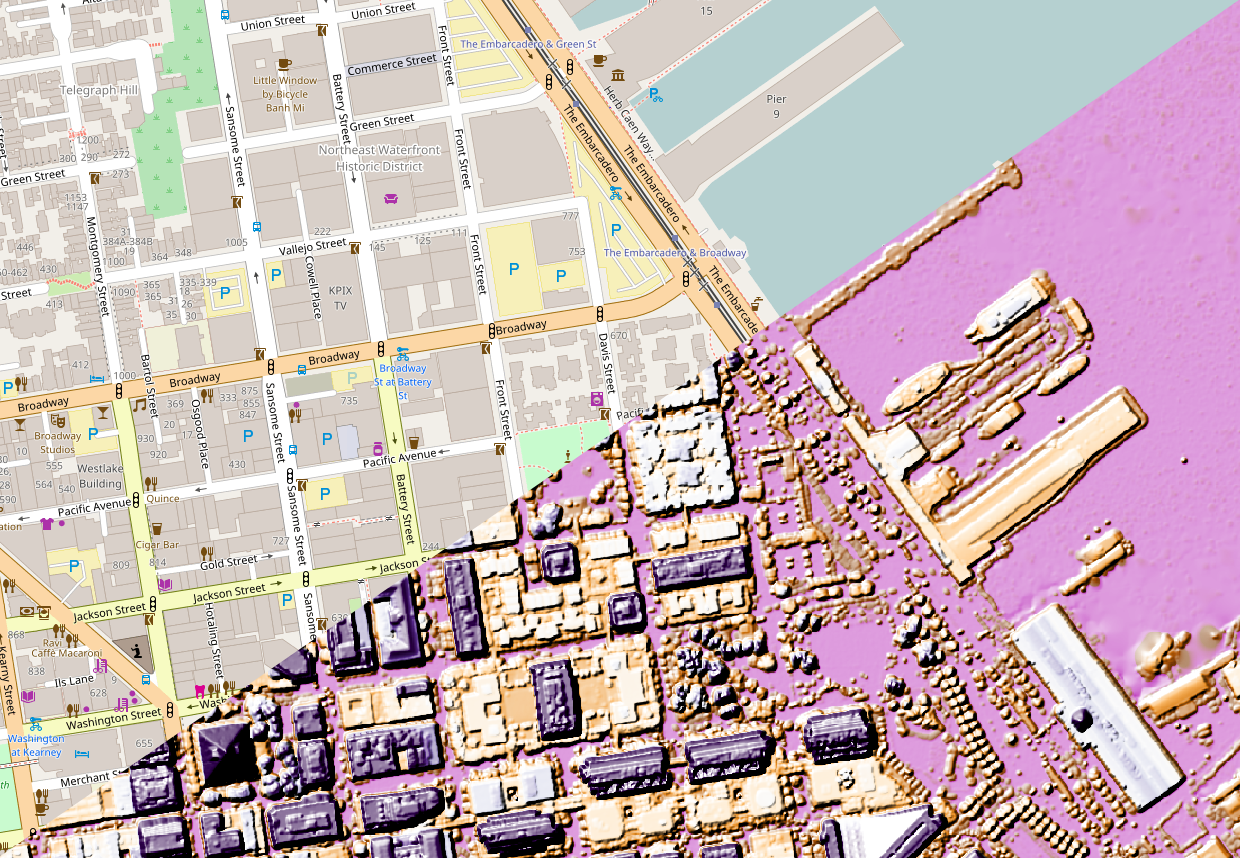
Adding height to existing buildings will enhance the data especially when used with popular renderers like OSM Buildings and Mapbox GL JS.
We are using raw LIDAR derived building height data released by SF local government under a CC0 (Creative Commons) license (data download here).
For each building in OSM, we compare the footprint from SF goverment buildings, if there is 70% overlap, we add the height. Buildings with existing height tag won’t be touched.
The task is hosted in OSM-US. The importing has begun at http://tasks.openstreetmap.us/project/71
Note: Before jumping into the task, please read all the instructions carefully.
To know more about the project, or if you have ideas please post them here:
… 모든 항목 보기
Here are the few OSM edits we have noticed in the last week. Observed that many experienced mappers need to think of a good changeset comments while they upload their changes to main database.
If you come across any unexplained mapping from an OSM user, let them know through your changeset comments and send them related resources, wikis, tagging system to new mappers, and encourage them to map in good way.
Thank you!!
Observations of mapping behaviour on OSM can give an insight into recognizing recurrent mapping problems our mappers are facing. Here are few of the issues observed between 18th July - 28 nd July on OSM:
House numbers were given in name=* tag: 1. Community responded with a comment and provided building wiki resource to the user.
‘casa’ spanish for ‘Home’ were given to residential buildings:1. Community responded with a comment.
Buildings were given name=* tag with key values such as ‘Cra’, ‘Calle’, ‘Betos’, and house numbers: [1] (osm.org/changeset/38657218#map=17/11.00815/-74.79661). Community responded with a comment.
Classification of highways were changed in Moscow: 1. The Russian community responded with a comment.
Lots of untagged nodes, market place was deleted: 1, 2. Community member reverted 1st changeset and commented on the 2nd one.
Retraced highway over previously existing one creating crossings: 1. Community responded with a comment.
Deleted highway: 1. Community responded with a comment.
Castles added: 1. Community member responded with a comment.
Failed import: 1
A ton of tourism = attraction, tourism = camp_site tags added:
If you come across any unexplained mapping from an OSM user, let them know through changeset comments. It starts a constructive discussion we can learn from and creates a positive environment for the OSM community to work together.
Look forward to seeing more of this next week.
From last week I’m noticing lot data coming to OpenStreetMap using DigitalGlobe imagery. Some users are adding residential roads and overlapping the primary roads.

Augmented changeset viewer: https://overpass-api.de/achavi/?changeset=40938983
Throwing here a small post to let know the community.
I noticed buildings imports back in February 2016 which were having building=yes tag for all building nodes. Have captured the details here.
OSM user: geopeppe imported all these buildings and after my message, he cleaned unnecessary tags on nodes but now only exists are:
I’d like to inform the community of Italy about this import and take next actions towards clean up or right documentations.
Data quality is as important a function for any contributor to know as is adding large quantities of detailed data to OpenStreetMap. If we were talking one or two individuals editing, quality assurance would be straightforward, but what about with 2.4+ million registered users adding 2,000,000+ nodes a day?
Luckily, the tireless vigilence of active contributors is a source of some consolation but nearly not sufficient by itself. The important question then becomes, how can we detect and remedy mistakes and acts of vandalism as and when they happen? In trying to find answers we’ve put together a “Validating OpenStreetMap Guide” which aims share our learnings to working with OpenStretMap. The guide covers the basics of handling data validation in OpenStreetMap by defining problematic data, tools for detection, methods for investigation, and avenues for resolution for individual and community mapping efforts.
 History panel showing different details about users and versions
… 모든 항목 보기
The union territory of India, Chandigarh has been mapped well with neat buildings, highways. There are so many OSM contributors to this city. OSM India community is thankful to all the mappers who have contributed to mapping the city in a detailed manner. Oberaffe and chandusekharreddy have made mentionable number of edits . : )

… 모든 항목 보기