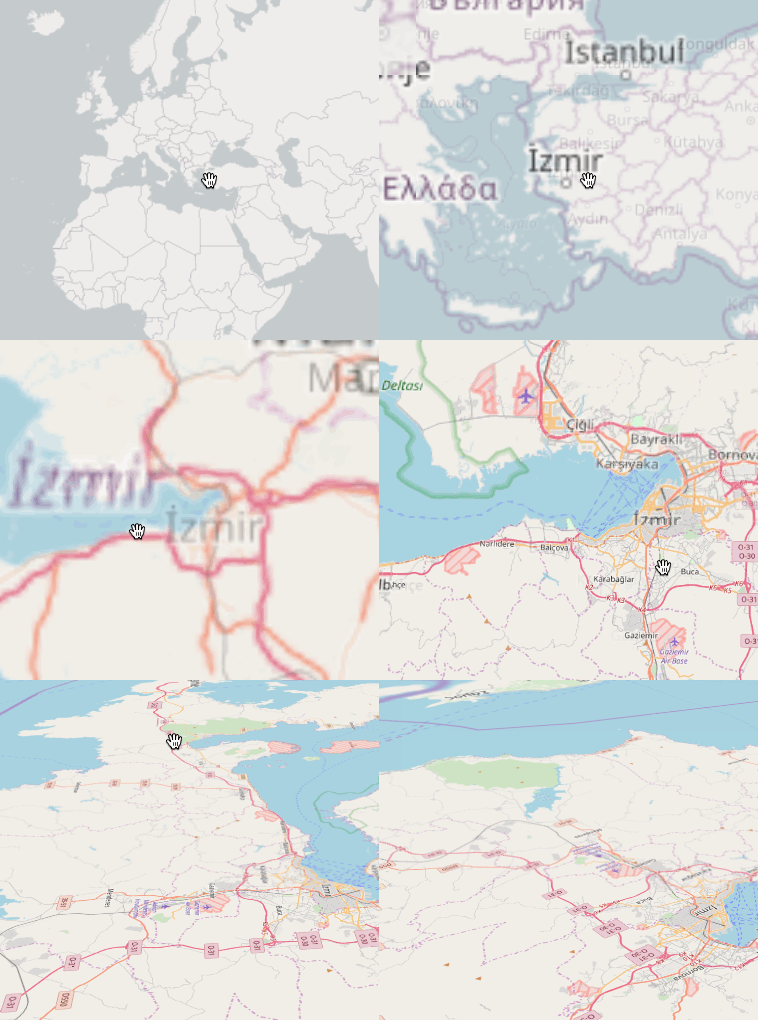
Was fiddling through the Mapbox GL JS API today, and thought i’d see if I can get the default OSM raster tiles to render on GL. Turned out to be surprisingly easy using this example.
Result:

Demo+code: http://bl.ocks.org/planemad/5670e14b67e3eb82b707ba46c9d3010f
Notes:
- The OSM tiles are raster which are rendered at discrete zoom levels, but the GL interface allows for smooth scrolling. The result might be slightly blurry tiles and may not be as crisp as viewing them in Leaflet.
- The original example was for adding a WMS layer. So any external TMS/WMS layer should work by swapping the tile url in the code. See osm.wiki/Tile_servers for options.
- The color transition of the tiles from b&w was achieved using the raster-saturation property and zoom functions. Not sure if this is practically useful, but definitely avoids needing to render separate b&w tiles.
- An alternative to using Mapbox GL JS for viewing the OSM tiles in GL is to use OpenLayers

토론
2017년 12월 22일 16:01에 imagico님의 의견
You should however add that this is just the normal raster tiles from the osm.org tile servers rendered with WebGL. It is not a vector tiles based version of the standard style like what Rory/Geofabrik have showed some time ago:
https://github.com/geofabrik/openstreetmap-carto-vector-tiles
Any post processing like for colors or rotation or other coordinate system transforms come with the usual problems of posterization/sampling artefacts etc.
Openlayers/Leaflet IIRC also offer b&w conversion, rotation etc.
2017년 12월 22일 20:25에 PlaneMad님의 의견
OpenLayers is definitely an alternative and have added that. Not sure if leaflet can do this, do share an example if you find it.
Creating a GL stylesheet of osm-carto will be quite a challenge, the label placement/collision in GL does not seem as mature as mapnik. Still might be a interesting project to try out.
2017년 12월 22일 20:43에 imagico님의 의견
Grayscale rendering and other color processing with Leaflet - using canvas/CSS and not WebGL:
http://humangeo.github.io/leaflet-tilefilter/demo.html
2017년 12월 23일 11:27에 mmd님의 의견
I noticed that your demo loads vector tiles from tiles.mapbox.com in addition to the raster tiles from tile.openstreetmap.org (although you won’t see them). And then there’s the Mapbox API key, which I wouldn’t expect for such a demo.
2017년 12월 23일 11:30에 PlaneMad님의 의견
Thats right, haven’t figured out how to have just a blank style and add a TMS layer. One would not need a API key then.
2017년 12월 27일 19:46에 ikonor님의 의견
Thanks for the example. Nice gimmick transitioning the saturation.
Not sure if above quote is implying this: not only scaled tiles at fractional zooms are blurry as expected, but currently on some environments also at discrete zoom levels, see issue #4552 Raster tiles aren’t perfectly crisp at integer zoom levels.
2018년 2월 3일 17:29에 ikonor님의 의견
Update: issue #4552 is fixed in Release v0.44.0.
2018년 11월 27일 11:47에 PlaneMad님의 의견
@mmd Updated the code to not use the Mapbox API. One just needs to use the empty style from https://cdn.jsdelivr.net/gh/mapbox/mapbox-gl-styles/styles/empty-v8.json