
As there has been an Address import in the Brussels region, and the Flemish Agiv also opened a database with address positions (not good enough to import directly, so we agreed to draw the buildings from aerial imagery while adding addresses, that way we at least check consistency of addresses). In Flanders, it’s a slow import that started around the end of 2014.
So I wondered what evolutions were visible lately. If it was possible to see where people were editing. Stuff like that.
First I investigated the total number of addresses per province. Brussels capital region doesn’t have any provinces, nor does it belong to a province (although it’s completely enclosed by one). But Brussels is included next to the provinces, just to cover Belgium completely.
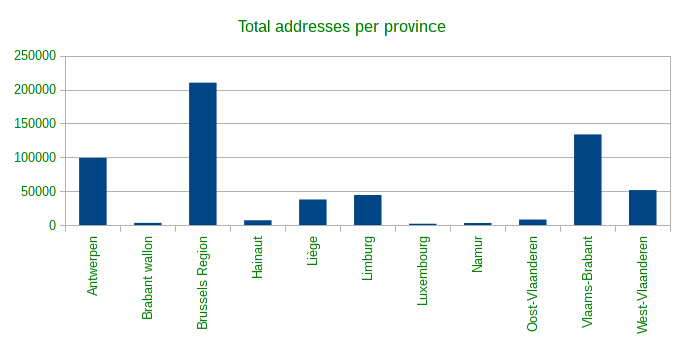
Here you clearly see that Brussels has many addresses mapped. Most likely due to the import. But between other provinces, there are also major differences. Oost-Vlaanderen and Vlaams-Brabant are both part of Flanders, they have the same resources, but there’s a major difference. The population also doesn’t seem to matter, as Oost-Vlaanderen has almost 1.5 million inhabitants, and Vlaams-Brabant has just 1.1 million.
Then I wanted to compare addresses with their data types, to see if nobody just imported nodes from Agiv without drawing the buildings. Nodes as addresses are not forbidden (f.e. on an entrance), but the clear majority should be on buildings.
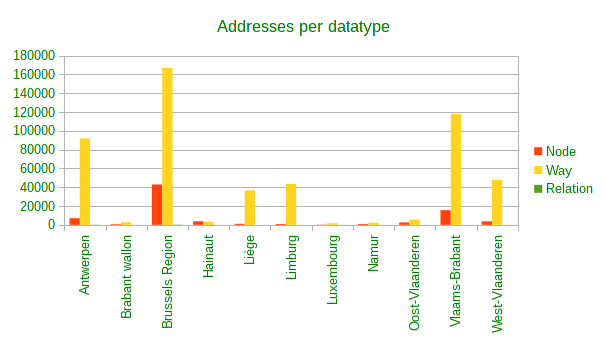
Ok, this looks good. Most addresses in Flanders are on buildings. Ratios seem rather constant. There are a few addresses on relations too (normally multipolygons), however, too few to be visible.
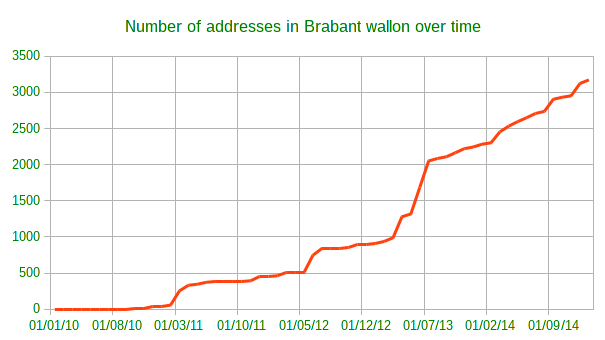
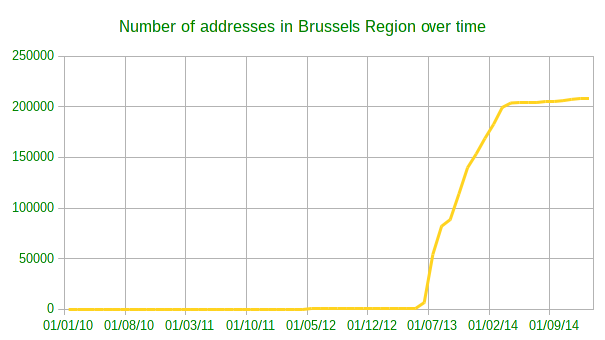
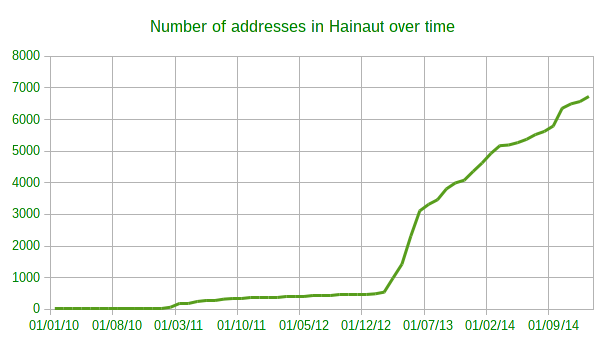
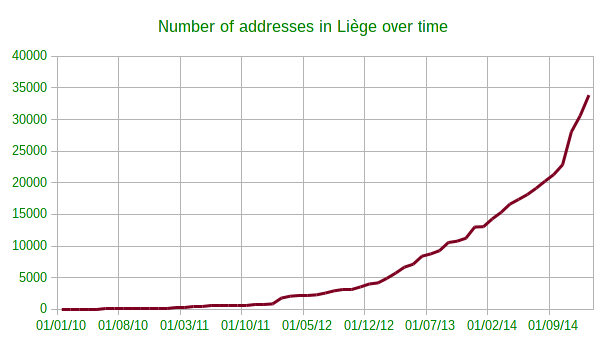
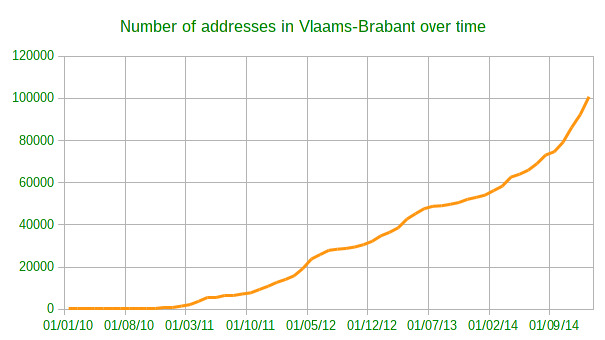
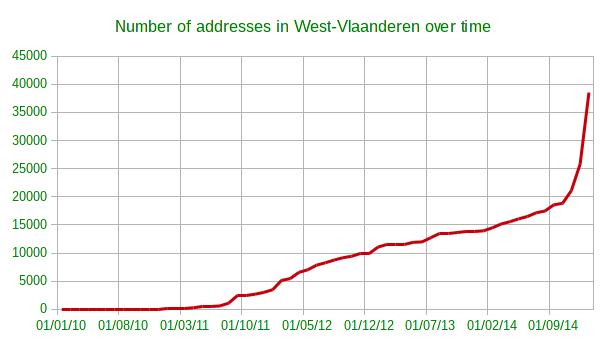
After that, the evolution of addresses through time is also interesting.
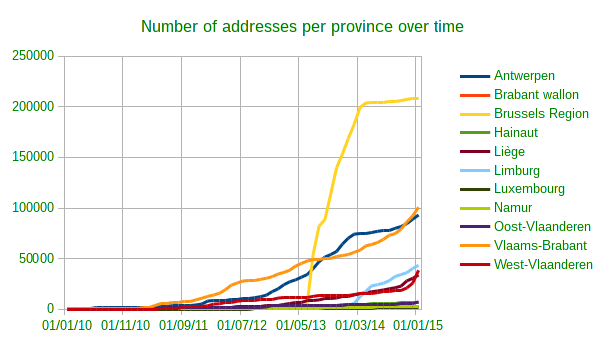
Here you clearly see the import of Brussels. Skyrocketing all provinces. But address mapping in some other provinces is also gaining traction lately, however small.
Overall, I’m very surprised by the differences between the provinces, even if you ignore Brussels. And I hope address mapping in other provinces will gain some more traction.
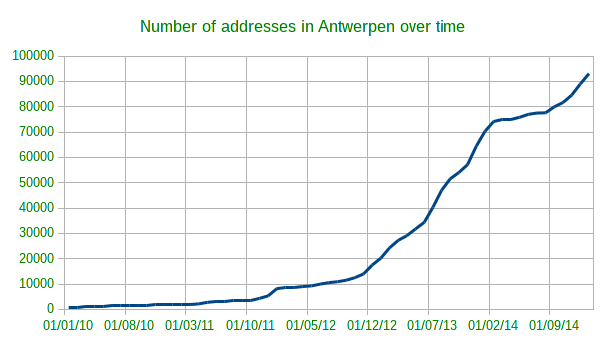
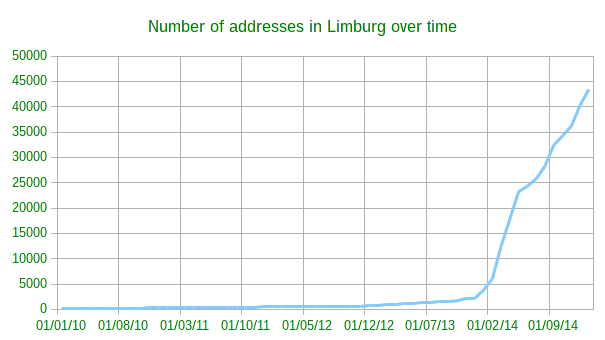
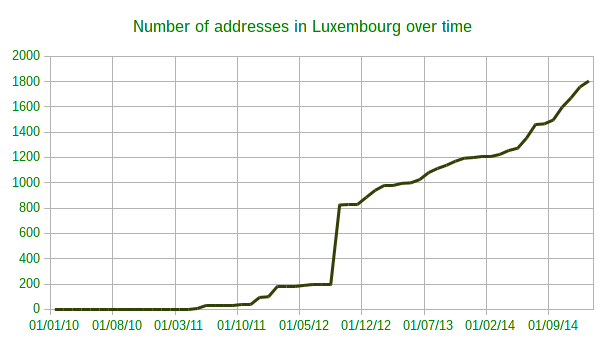
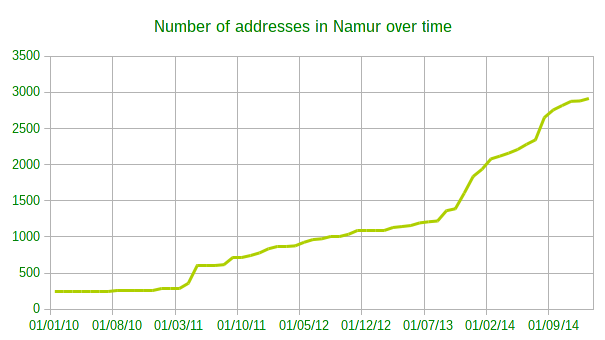
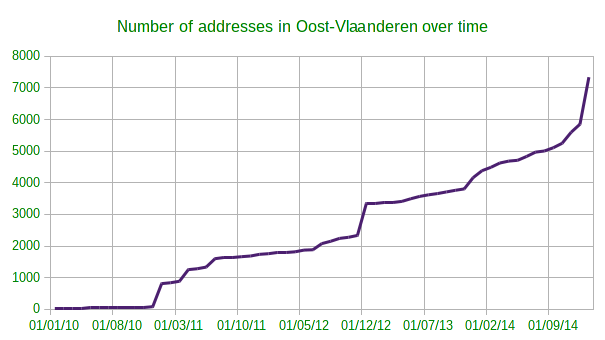
As a final treat, I give you some graphs per province.
討論
由 Polyglot 於 2015年02月 6日 17時13分 發表的評論
The addresses on nodes in the Brussels region can be explained by houses with more than 1 house number. Many houses on corners have 2 over there and ofc many have also been merged.
The data conversion was quite easy, as we started with high quality data, including building contours to booth. OTOH, I don’t think a lot of checking has been done during the import phase.
Anyway, I only converted the data and added a few streets here and there. The import was executed by local contributors, as it should.
Polyglot
由 Sanderd17 於 2015年02月 6日 17時16分 發表的評論
Node vs way ratios seem about equal between different provinces and Brussels. Next to that, Brussels is fully urbanised, which makes drawing building outlines and assigning addresses to buildings more difficult. So that number of address nodes is about expected I guess.
由 Glenn Plas 於 2015年02月 6日 19時19分 發表的評論
Love this stats stuff… The nodes are indeed needed from time to time, I always make sure that it’s on an entrance if possible, very few are amenities with addresses. I also think that the quality of the areas I did was excellent. I’ve been looking elsewhere (Mechelen for example) and there are spots where I find 20 nodes on the same spot. The errors in Mechelen I wrote them down and after 2 hours I had 3 A4’s full. I love mapping this stuff but I can’t spend twice the time on entering all those errors in LARA. I wish we had some more automated way to push this upstream.
The only remark about the data that really bothers me are numbers like this : ‘73S’ ‘72K’ .. Really weird ones, it’s not like appartment A,B,C , just random I see numbers with O after it. It does look like the source of them is interpolation. I do not transfer those numbers, that is why in the end, there will always be incomplete streets in the tool, even though in OSM it’s ok.
Also, your remark about me changing building=house into building=yes , I figured out that the terracing tool was doing that so before I merge the numbers with buildings ( I do them all manually) I add building=house on the nodes first. Then the terracer will warn me when the existing building has been tagged differently. I had to redo thousands of houses I thought I finished up.
由 Sanderd17 於 2015年02月 7日 09時24分 發表的評論
Well, if the errors are systematic for one street, I guess you can mention all errors in one report. The reports are read and processed by humans, and not by computers.
And for me, the terracing tool seems to take the tag from the building outline. So if the ouline is tagged with building=house, all houses will be tagged as that.
由 joost schouppe 於 2015年02月 7日 19時41分 發表的評論
Hey Sander,
I did some analysis myself on the history files. I use Mazdermind splitter and importer tool, so deleted items linger around and I’m not sure how it handles relations. Here’s what I get for Flanders:
My numbers seem to be a lot lower. Any idea why that might be?
My definition of an address was “has an addr:street and an addr:housenumber tag”
由 joost schouppe 於 2015年02月 7日 19時46分 發表的評論
So I should have tried the preview first…
由 Sanderd17 於 2015年02月 7日 20時04分 發表的評論
My definition of an address was just addr:housenumber, as there are still a number of associatedstreet relations around.
And my numbers seem to match the total on http://qa.poole.ch/addresses/
In any case, I’m more interested in the evolution and regional differences than in the absolute numbers.
由 MartinDiazAlvarez 於 2015年02月11日 05時59分 發表的評論
Nice work on the data and graphs.
由 Stereo 於 2015年09月 1日 13時05分 發表的評論
Do you have an idea how complete this is, compared to the counts of the official datasets? For example, in the Grand-Duchy of Luxembourg, we have 18143 addresses on OSM, out of about 150k in the official, georeferenced address database that’s not yet open data.