
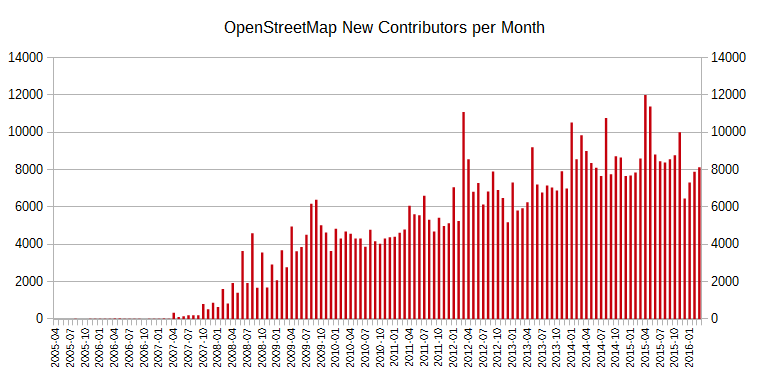
Like a broken record (hmm can youngsters actually relate to that?), at the end of every quarter, I’ve updated the contributor statistics on our wiki.
As you may remember there was an unexplained big drop in December of last year, the new numbers show some recovery from that, but not to the 2nd and 3rd quarters of 2015 levels.
討論
由 Warin61 於 2016年04月 7日 23時09分 發表的評論
Broken CD? Broken as in scratched rather than in a million pieces.
Even CDs are getting old hat ..
由 PlaneMad 於 2016年04月 8日 05時45分 發表的評論
It seems like the end of the year sees a regular pattern of drops .
.
由 SimonPoole 於 2016年04月 8日 06時04分 發表的評論
@PlaneMad except that in depth (numerical) analysis doesn’t really show a clear seasonal pattern. Yes, sure, end of year tends to be slower, but thats about the only thing that can be said, it clearly doesn’t explain the specific large drop (which btw your highlighting shows nicely).
由 argoss 於 2016年04月 9日 12時12分 發表的評論
Drop might have something to do with Google introducing offline maps in their app. Some people might decide to use Google Maps instead of an application with offline maps based on OSM.