A "rural pedestrian" vector map schema and style
Posted by SomeoneElse on 11 November 2024 in English.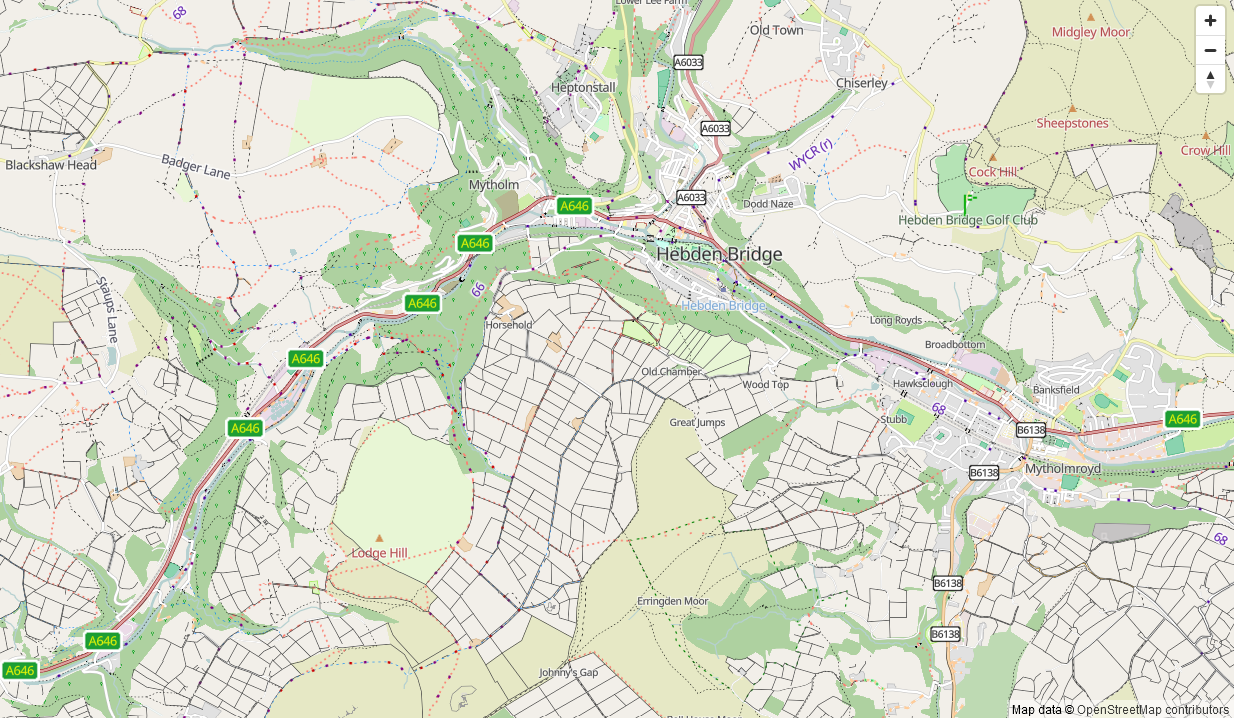
For some time I’ve been looking after a raster map style that’s designed to be a useful “England and Wales rural pedestrian” map, and also to showcase some of the richness of data that might not be obvious from basic “general” map styles such as the ones on OpenStreetMap.Org.
A goal for some time has been an offline version of that map style. At any useful level of detail that requires different technologies to be used, and the first parts of that - a vector map schema and a web map style - are now available (though not yet available offline).
The online version of that map is available here. It’ll take a couple of seconds to appear.
How vector maps work
Essentially, something takes OSM data (such as a “.pbf” file) and creates “vector map tiles” from it, often as a large “.mbtiles” file. This file is essentially a small database containing information about what features are present at what zoom levels (but not what they should look like). The client (in this case a web browser running some JavaScript) reads a file that contains details about the desired display style and uses that to present map features to the user.
The software used to create the vector map tiles was Tilemaker. The Javascript libraries used by the web browser are from MapLibre and the map style was created using the MapLibre Style Spec.
Vector map schemas
Various vector map schemas exist for use with OpenStreetMap data. OpenMapTiles is one; Shortbread is another.
I looked at both of these, but neither contained all the data that I knew that I wanted. However, my existing raster maps already consolidate OSM data into a format designed for display, so the obvious approach was to define a schema based on that.
Both osm2pgsql and Tilemaker use lua for scripting, which means that much of the required code is already written needing only cosmetic modifications. Some code is already shared between the two projects; eventually most or all of the “schema” code will be.
Simplifying the schema
The raster display map style dates from what was in OSM Carto in about 2014, before it was changed to be less useful as a pedestrian map.
There are about 76 layers in there, which is significantly more than required. I reduced this to 9. Of those, “water” just contains merged-in coastline data and “poi” isn’t extracted by default (it’s a catch-all designed to spot another that hasn’t been picked up in “land1” and “land2”). The readme has more information.
The new vector map style
The styling options available with MapLibre are broadly similar to CartoCSS but with more control of how things change from one zoom level to another.
I’ve tried to make the new style more consistent both about how each layer is defined in the code, and also about how it appears. For example, all text uses the same font; with different colours used to show different classes of features and text size used to show differences in a class.
The fonts used are from Klokantech, in turn based on Google’s noto.
Road shields had to be reimplemented from scratch, resulting in proper UK/IE versions as opposed to the nondescript-looking raster ones.
When reimplementing the new style I found a number of feature combinations which had simply never been handled by the raster display code, such as derelict canal bridges, so the new vector display style actually handles more data combinations than the old raster one.
Some raster features haven’t been implemented fully or at all yet - notably “way area” controls on zoom level of things such as island names.
A debug vector map style
In order to see what’s present in the vector map tiles a debug style has also been created, although that is not yet deployed anywhere.
Speed and size
The vector tiles and the style to interpret them are quite large, so loading an initial page does take a few seconds. This is less of an issue than it might be as the eventual goal of this project is offline maps; if map tiles are already on a device the time to load is obviously less.
Creating a vector map of Britain and Ireland takes 12 minutes on a server where a database reload of the equivalent for raster maps takes 90. Each resulting “.mbtiles” file is about 4GB; each equivalent database for raster tiles about 40GB, plus about 10GB of metatile cache.
More information
See github projects SomeoneElse-vector-extract and SomeoneElse-vector-web-display, and readme files for the schema scripts, the schema itself, the style management scripts and the style itself.
ચર્ચા
Comment from Endres Pelka on 11 November 2024 at 22:06
I like the fact that the names of bodies of water (ponds, pools, reservoirs) are shown already at low zoom levels… Easier to spot the Former Tubbytronic Superdome :D
Comment from bonoky on 17 November 2024 at 20:14
Hello Andy, great work, thanks for sharing your efforts with us, it’s a great step forward. Can I request you display the PRoW references where they are available. I use that feature a lot on your other non-vector map, but being on line only it is of limited use because a lot of the time when out in the countryside the mobile signal is unreliable.
Comment from SomeoneElse on 17 November 2024 at 21:28
Re prow_ref, both maps should have that - raster and vector. There are a couple of obvious differences though:
Comment from SomeoneElse on 18 November 2024 at 02:33
Making the label text smaller means that it looks a bit less rubbish most of the time. Water names are now dependent on way area (but there’s more to do with other features there).