開放街圖標誌 OpenStreetMap 開放街圖

barefootstache 的日記

最近的日記項目

Foreword

In ‘week 60 of 100’ wrote about an OpenStreetMap exploration session with the bike and from it I realized that a machete would help to traverse through the off-trail scrub portions. This fact I ignored, mainly due to the reasoning of being early in plant’s yearly life cycle, thus the green matter would not be as intense. This intention held true, though the hard matter still persisted and without hard duty gear, navigating through thorns one can become injury prone with scrapes and/or punctured clothing. Nonetheless since these obstacles are expected, the attitude attacking these are not as dire as when it is unexpected.
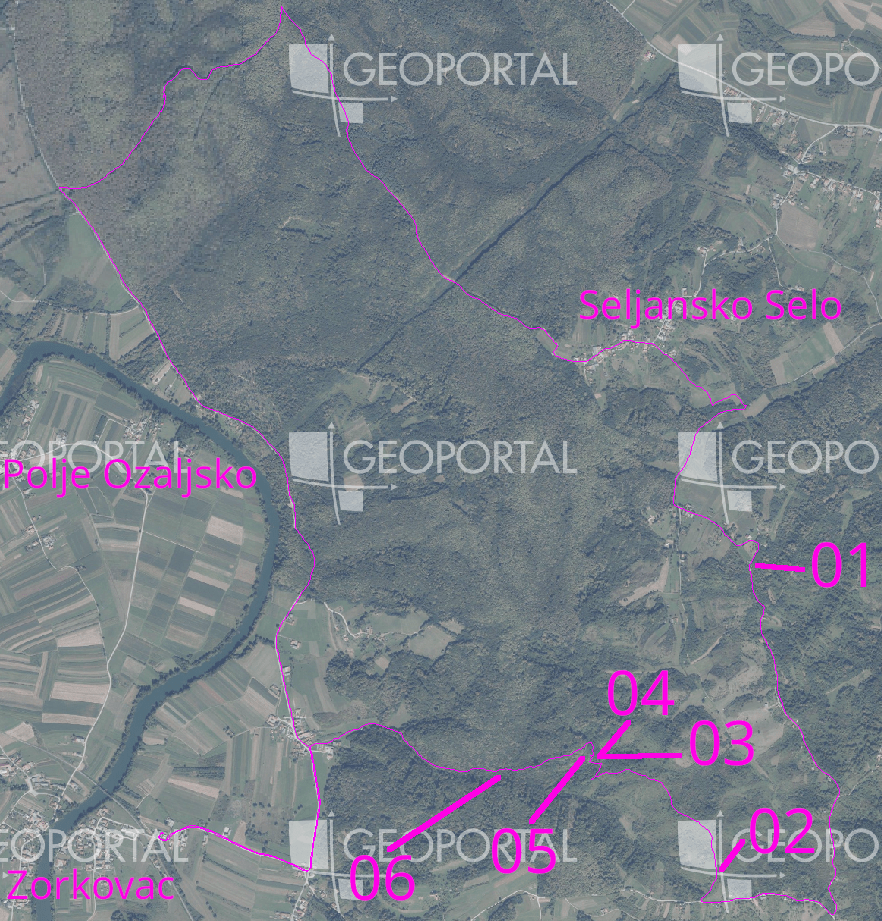
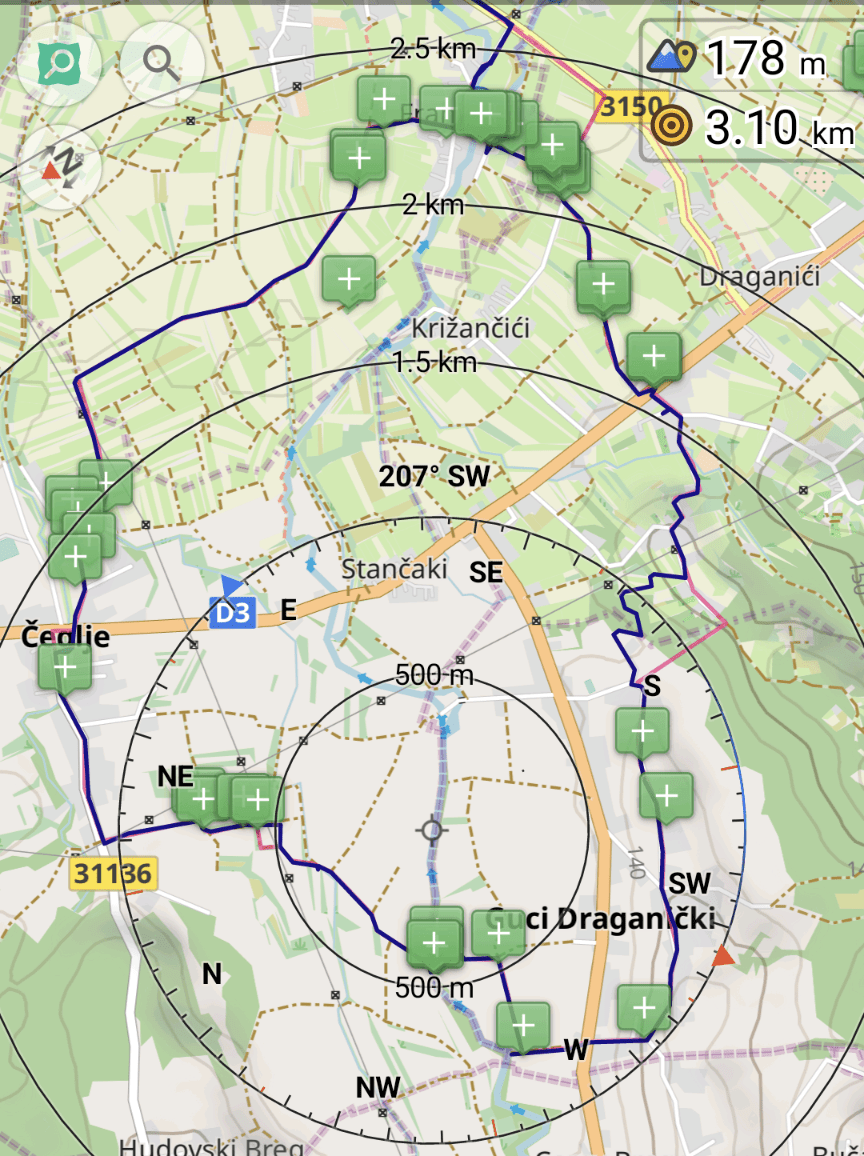
Route planning

(The red line is the planned route whereas the dark blue is the tracked one.)

The red line is the planned route whereas the dark blue is the tracked one within the OsmAnd app.

查看完整日記項目

位置: Hudovski Breg, Čeglje, Grad Jastrebarsko, Zagreb County, 47201, Croatia

Let’s take a look at addition and division mapping of natural and landuse. First we will look at the inconveniences that exist when mapping such areas. Next we will look at the method behind division mapping and scenarios of how to apply it. And finally take a real world example of how these two mapping styles were applied.

The definition of addition mapping is the act of adding new data to a white spot area aka an area with no data.

The definition of division mapping is the act of taking an existing object and dividing it down into smaller partitions.

Inconveniences when mapping natural and landuse

There are two main inconveniences when mapping natural and landuse from aerial imagery. First, depending on the resolution of the imagery, deciding where to make a clear cut if it is a distinct natural or landuse area. And second, the amount of clicking required to create a new area.

For the first inconvenience, more or less, it is personal choice and level of details. E.g. try to answer this question: when would one make a distinction between natural = scrub and natural = wood? The difficulty exists in the fact that the value scrub permits trees and lots of time these trees are/aren’t growing close enough to each other.

For the second inconvenience, lots of editors have the option to split a way (aka division mapping). In JOSM you can split an area with ALT+X (UtilsPlugin2 required). Or manually split the circumference of an area at two nodes and then separately connect the two arcs.

UtilsPlugin2 - Split Object tool

Let’s say one needed to create 4 square farmlands in a grid layout. How many node clicks are required?

Mapping the traditional way (aka addition mapping) 16 node clicks are required. One square has 4 nodes, and there are 4 squares, so 4 * 4 = 16.

Mapping with UtilsPlugin2, it takes 8-10 node clicks. There are two methods to achieve this. The first step is equivalent for both methods by drawing the circumference which is 4 node clicks.

Method 1

查看完整日記項目

位置: Bencetići, Mjesni odbor Mrzljaki - Goljak, Draganić, Municipality of Draganić, Karlovac County, 47201, Croatia

Taking a brief look at the Croatian country side, one will notice that lots of the tracks/paths end without an exit. Additionally, when navigating at location, one will realize that only a fraction of such highways exist on the map.

How to plan a route for exploring?

The amount of exploration sections should reflect one’s physical capabilities. In the beginning about one exploration per route should suffice and can be increased through practice and knowledge of the area. One shouldn’t bite off a bigger chunk before one can handle it.

In this example of about 16km route

16km route throughout the east hills of Zorkovac, Croatia

I chose one exploration section every 5km in such a matter that not more than 500m of distance was needed to be explored.

There was one section in the north that was an easy gravel highway connection,

查看完整日記項目

位置: Bošnjak, Zorkovac, Grad Ozalj, Karlovac County, 47286, Croatia

In Croatia some residential areas are well kept, while others are quite lacking. Example: Zadar vs Preko.

What to map?

This begs the question which entity should be mapped first with the largest gain for the effort? This can only be answered in the need of the beholder. For a tourist it would be street names, since accommodations are bound by an address and after the town name, the street name is the next factor to reduce the search area of the location.

There is a major requirement for this to fruition and that is that the town has to have varied street names. Depending where in the country one is traveling, it is quite typical that the street names are equal to the town’s name (e.g. Lazina). In such a situation latitude/longitude coordinates should be a requirement of the host to provide over the house number, because lots are not linearly arranged. Plus lots of such towns don’t have house numbers and/or buildings on the map.

Where are the buildings?

Lots of towns have buildings, though these are usually only a fraction of what actually exists. E.g. in Preko:

查看完整日記項目

位置: Komiža, Grad Komiža, Split-Dalmatia County, 21485, Croatia

This week continued working on the barefootstache-mapping-croatia project to align with my upcoming trip to the area.

While mapping east of Vrbanci, I noticed that I was almost done with its boundary and completed it.

before and after animation of OpenStreetMap depicting land cover addition mainly farmland, meadow, heath, scrubs, wood, and many other land covers

Quick Overview

查看完整日記項目

位置: Lazina, Mjesni odbor Lazina - Franjetići, Draganić, Municipality of Draganić, Karlovac County, 47201, Croatia

MappingChallenge - Week 55 of 100 - Trees

於 2023年九月 4日 由 barefootstacheEnglish發表。

Tree mapping is a task that is better done in person than using aerial imagery, unless it is a tree row. The reasoning being that node placement of natural=tree is more precise than looking from above, since more often than not the imagery is not that clear.

Trees tell a story

When looking at this area it is fascinating how one can make out man made structures relative to the placement of trees.

trees and tree rows as nodes and ways in JOSM

Further once adding the leaf_cycle and leaf_type one can create shade maps that could be practical during heat waves like at mapasdesombra.org or if jveuxdusoleil.fr extended its algorithm to include tree details as well.

One can add the tree’s height and diameter with a check date to create a timeline of the tree’s lifespan, though also add more potential data points in ecological terms.

Or one can add the genus and/or species to ease the search for foragers like mundraub does with their overlay map.

Tree specification

查看完整日記項目

MappingChallenge - Week 54 of 100

於 2023年八月27日 由 barefootstacheEnglish發表。

It has been just over a week that I have accomplished the 365 daily MappingChallenge (Mastodon) and decided to persist with a 100 weekly challenge instead. One of the main (Mastodon) reasons is how daily contributions are being processed based off of UTC+0, which is manageable if one does not travel. Further this week I have decided to use the OSM Diary over Mastodon, since this way I can do long form entries with less constraints and possibly reach a larger audience.

Quick overview

In week 54:

  • 34 change sets created in total
  • 5327 node changes in total

all were done within JOSM.

Changes

  • extracting sidewalks from roads
  • splitting up schools
  • adding roof shape and roof material

Puchheim Realschule and Gymnasium

Location

Before and after animation of building geometry changes of a school district

Puchheim Mittelschule and Grundschule

Location

查看完整日記項目

100 Day Mapping Challenge

於 2022年十一月25日 由 barefootstacheEnglish發表。

For those who have been following my daily progress on Mastodon, here is the summary.

Data Collection

  • StreetComplete: each quest
  • OsmAnd: each POI
  • Notes: each note
  • SOTM22: each talk
  • droneImages: each image
  • OSMTrace: each trace
  • WikiData: each image for WikiData
  • vespucci: each changeset
  • idEditor: each changeset
  • JOSM: each changeset

First 50 days

Graph shows how often an app was used and what average changes were

During the first 50 days I was mainly doing the challenge remotely, which can seen quite well that a lot of mobile apps are present.

Second 50 days

查看完整日記項目