jonwit's Comments
| Post | When | Comment |
|---|---|---|
| should have told the truth | I tell everyone to Google but I too use Bing as well |
|
| City Heights, Mapperley Top | Some people do not like individuals doing things they think of as violating their privacy. Like the US Census in 2010: More Than 100 Census Takers Have Been Assaulted Or Attacked This Month There are many tips out there for keeping safe while doing these types of surveys Trust your instincts. Remove yourself immediately from any situation you feel is unsafe.Walk in lighted areas. |
|
| Howto to complete HOT-Tasks |
|
|
| Welcome to the new Missing Maps |
On a more serious note, I hope Amazon Web Services is giving you a break being a Non-Profit. I see you already are discussing this on github
|
|
| Re-tagging quadrant routes in Pennsylvania, USA from `ref` -> `ref:penndot` | The Keystone State thanks you!
|
|
| How to increase the number of regular HOT mappers in 2016? | ||
| Local coverage | It appears that Franklin TN already has a robust GIS system in place already with building footprints. Franklin TN GIS Department Perhaps a more effective method would be to ask them nicely to share their data with OSM. Some examples like Chicago, Chicago Buildings Import. Zambia, and within the last few days Montgomery County. -Jonathan |
|
| Distribution of locales (languages) among HOT tasking manager contributors | Fantastic summation of where people are contributing!! I did a quick pivot table and summarized the language by the first 2 letters using =left(a2,2).
English has 42% of the changesets as well as the same amount of users. copy of the spreadsheet with my edits Also I did a sum on the changesets on the first table and got 3,751,363 However when I combine both ID and josm i get 5,000 more? Im sure theres something im missing. id 2,148,541 josm 1,608,182 combined total changesets 3,756,723 Keep up the great work! |
|
| Update on my status |
Looks like you got alot of work to do!! San Luis Obispo, CA.
|
|
| Quantifying HOT participation inequality: it's complicated. | The Long Tail distribution of the data-sets are crazy. All the projects depict a hoard of individuals with a few edits and a few crazy mappers. I put your datasets into SPSS and it looks like your charts seem to be exaggerating the few editors that completely skew my graphs. Its been a few years since my statistics class but maybe i can get a statistical test to run.
|
|
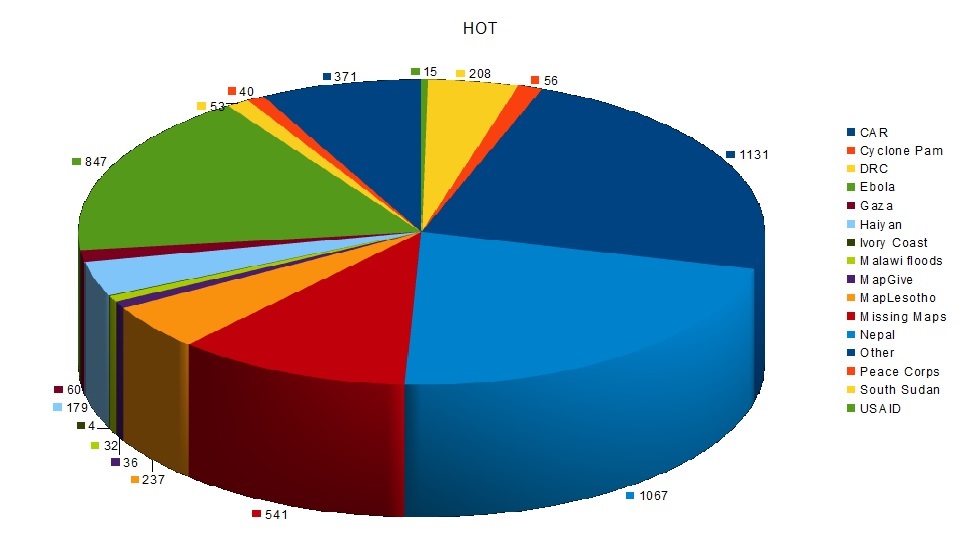
| Quantifying HOT participation inequality: it's complicated. | This is tremendous I did a quick pivot table on your dataset and calculated how many 8 hour workdays each project would take. Nepal has 1,067 work days by 6,383 people. That’s 3 years of data added!!
|
|
| Starting with OSM Mapping: Mapping my hometown, Jorhat | I used a simple gif maker to animate it to see the difference The link
|
|
| A Review of the Manifests of all OSM US Board Election Candidates | Thank you for your strong criticisms. You have pointed out many serious flaws in all the candidates, myself included. I for one have limited experience with JOSM relying mostly with ID editor since the knowledge of the area i’m mapping has been a blank map before I started. I have begun collecting images using mappillary and will soon be using JOSM to do more precise edits. There have been many great ideas discussed over at the town hall that you should check out. |
|
| How to find Missing Roads in OSM with GPS data | neat |
|
| post-vacations map editing | Take me with you next time |
|
| Initial activity and retention of first-time HOT contributors | When it comes to data science you excel. How did you calculate time? ~70 minutes thats fantastic!! |
|
| HOT Board Special Election Statement | Awesome post !! I wonder how you think HOT can help out in disaster areas of places with governments that aren’t friendly with international organizations were maps can still make a difference. North Korea Famine/Drought or Syria |
|
| Mexico and INEGI present at New York City State of the Map US 2015 | Excellent job and presentation!! |
|
| Proposed talk at both SOTUM and HOTOSM conferences!! | You can find my presentation at the HOTOSM summit as well as other information on the project page I started. I plan to update the project page with more relevant information soon and start cleaning up the dataset further. New diary post soon!! The JMU website you found the Balkan map from is from the Journal of Mine Action. Bosnia Profile Page. The dataset used for this is controlled by the Bosnia and Herzegovina Mine Action Centre (BHMAC). Like other datasets they need to release it under the same license as OSM for us to incorporate it into the dataset. |
|
| test | buona giornata |
 Everyone makes mistakes.
 I like pizza parties.


 # Napa, CA