OpenStreetMap 标志 OpenStreetMap

joost schouppe的日记

最近的日记文章

In Flanders, all traffic signs are open data. This information is hugely useful. Well, it could be. Most of the traffic signs date from several years back and have not been updated since. The Flemish Verkeersborden.vlaanderen project intends to change that. Municipality by municipality, we see updates starting to happen. Several of them have done a complete update, or at least do occasional additions.

In a perfect world, when the municipality decides to change a traffic situation (a new speed limit, a new one-way restriction,…), they start to work in this database. First there’s a planned sign. Then when it is installed, it becomes a real sign. The real sign is offered to the OSM mapping community (and Waze, TomTom, Here, …) and they add the info to the affected street - almost in real time.

We’re not quite there just yet, but the edits in the database that do happen are still useful. Obviously because it makes for a better map. Less obviously because it saves everyone a lot of time. We often get a mail from municipalities: “hey, we have changed reality, can you now change your map”. We want to be able to say: “oh we know, we already updated it!””

So we’re building on a tool in good Road Completion tradition to make sure that if the government provides the data, we can guarantee that we’ll be up to date. This in turn might be a little incentive for more municipalities to keep their bit of the database online. Just like in Road Completion, we “accidentally review” the government data as well. When we map traffic signs, we spot errors. Often user error, sometimes logical errors. These can then help municipalities to improve their data quality or even local reality. OSM data users will be able to see how well we keep track of new traffic signs - they won’t have to trust us on our word that the data is good.

查看完整日记文章

Opening up streetlevel imagery

With OpenStreetMap Belgium and our umbrella Open Knowledge Belgium, we have been lobbying to get governments to collect their street level imagery in the open.

While there are many projects to collect images, almost allways the government does not retain ownership of the imagery. Instead of paying for data collection, they pay for access to the data. This means the price is low for the individual governement organization, but in our complicated political landscape of federal, regional, provincial, intercommunal, or communal organizations, many are buying access individually. In the end, the total cost for the tax payer is higher, without there being any open products that can benefit the rest of society.

We believe payment for the data collection should happen only once, and ownership of the imagery should be transferred to the government. This would result in the lowest cost overal. By releasing the imagery as open data, its value for society is increased even more. Access to extra services can incentivise governements to pay up for the base data collection.

Slow progress

While the intercommunal organization WVI (Dutch text) has contributed open 360° imagery for most of the industrial areas in West-Flanders, and three Flemish municipalities have shared 360° imagery taken by Vansteelandt, the vast majority of projects that we hear about do not result in open data.

This is why in 2022 we are launching the Open StreetLevel Imagery Project. We are scaling up our efforts to crowdsource open street level imagery at a low cost. We are investing a very small budget which we expect to have a significant impact.

The OpenStreetMap Belgium role

查看完整日记文章

位置: Nil-Saint-Vincent-Saint-Martin, Walhain, Nivelles, Walloon Brabant, Wallonia, 1457, Belgium

MapComplete theme for campers

joost schouppe 于 2021年三月16日 以 English 发布

The reason I’m writing this post is that my first MapComplete theme got merged into the official version. Yay! But first, an introduction.

Introduction

Having been freed from most OSMF duties, I got a bit of an OSM reboot as of late. I became more active in Belgium, where OSM seems to be booming. More people want to be involved, many more people care about what is on the map.

One of the projects that have made this a fun time, is MapComplete. I was always very enthused by projects like MapContrib - because they make it easy to create detailed thematic maps, while also being an editor for that specific theme.

I really believe thematic editors are the way forward for OpenStreetMap. Most of us here are people who care about “the map in general” (or at least a wide range of mappy topics). But most “normal” people don’t care enough about OSM data to invest in learning to use a fully fledged editor. Yet they might care more about data they really need - like whether they can store their bicycle safely, or if the power outlet is right to charge their car. Or they might be passionate about certain topics, like accessibility of paths in their neighborhood, public fruit trees, handicapped parking spots.

MapComplete is built to bring those people to OSM, instead of the plethora of POI databases that exist today. If you want to introduce MapComplete to non-OSM people, have a look at the project page on OSM.be (en, nl, fr). The project was started by PieterVDVN for a project to map the accessibility of neighborhood nature. During Open Summer of Code we expanded on it for the Brussels Region. Flemish municipalities are interested in it as well.

查看完整日记文章

Over the past years, the OpenStreetMap Foundation has worked hard to expand the membership. On the one hand, we want the core of the project to be run by people from all backgrounds. On the other hand, a larger membership makes it harder to buy your way into power.

Over the past year, MWG and Board worked on the implementation of the Active Contributor Membership (ACM). You no longer need to pay, or say you cannot pay to join. We now welcome anyone who is contributing significantly to the project by mapping or in other ways. The project was launched by the end of August 2020, and has already had a significant impact. A previous iteration of this was “the fee waiver program”. It was only available for people for whom the subscription cost of 15 pound is very high, or for whom making the payment is difficult (because of international banking issues). This program was launched around new years 2018.

Main impact

We compare the status at the end of the year 2018, with the membership right before the launch of the ACM and a few months later - mid November. Note that with the 90 day membership requirement for voting in the AGM/Board election, no snapshot exactly represents the voting population.

According to my count, membership rose from 1503 to 1939 in the period since the introduction of ACM. That’s over 400 new members or a growth of almost 30%. In this short time, the membership has grown more than in the almost two years before.

A lot of the motivation behind ACM is increasing geographic diversity. There has in fact been a significant shift. Where Africa was virtually unrepresented back in 2018, it is now at 5,2% of the total membership. Asia shows a steady growth. South America did not profit much from the fee waiver program, but has seen a significant rise recently.

查看完整日记文章

My life as a Board member

joost schouppe 于 2020年六月28日 以 English 发布

Some time back, I wrote about my hopes and wishes for last year’s Board election. The reality has far surpassed my expectations. I’m impressed with how much has changed with the new set-up.

Even though ideologically, we remain just as diverse, this board is getting into much less conflict. Of course, we don’t agree on everything. But we seem to be much more capable to reach a common ground on things. This has made this Board, in my experience, much more productive than the previous one. What used to be an insurmountable hurdle, something small like switching from audio to video conferencing, was now quick, easy and straightforward.

Big part of that increased productivity, is that we have a new Chair (Allan Mustard), who takes the role much more as an active leadership role than the previous one. That is only possible because he happens to be recently retired, and willing and able to invest much more time in the role than any of the other Board members can.

We also have a new Treasurer - Guillaume was the only one to offer himself for the role, though he probably didn’t expect there to be no one else to volunteer. As he was starting the role, there was a crisis straight away: our bank kicked us out. The amount of time he has needed to invest in resolving this (and all the technical consequences of that) has been enormous, and beyond what can be expected of a volunteer. Thankfully, his free lancing was a little slow because of the corona crisis.

查看完整日记文章

位置: Fournol, Saint-Julien-de-Jordanne, Mandailles-Saint-Julien, Aurillac, Cantal, Auvergne-Rhône-Alpes, Metropolitan France, 15590, France

OSMF Microgrants project ready for launch

joost schouppe 于 2020年四月11日 以 English 发布 最后一次更新于2020年四月19日。

The OSMF is opening applications for the Microgrants project today. The Microgrants Committee explains what’s happening on the OpenStreetMap official blog. Read all that before you head over to the wiki to start your application!


The OSMF Microgrants project was set up by the OSMF Board and is run by the Microgrants Committee. If you have any questions, feel free to post them here or send them to microgrants (at) osmfoundation.org.

Collecting paths

joost schouppe 于 2020年三月26日 以 English 发布 最后一次更新于2020年三月27日。

In these days of social isolation, at least here in Belgium, we’re still allowed to wander in our neighborhood. One way to make that a little more interesting: collect all the paths! I mentioned this on Twitter, and was asked to make a tutorial. So here goes.

The general idea: make a map showing all the paths in your neighborhood. Then go and visit them all, and visualize which ones you have visited. Over time, you’ll see what direction you should be heading to add more paths to your collection.

Collect the data

No dataset contains as many paths as OpenStreetMap. You can see them on your smartphone (e.g. on Osmand, on the main OpenStreetMap website, or on whatever style of map you like.

For this project, we want to download the data itself. Assuming we’re just downloading a little area, we can use the awesome Overpass Turbo for this.

I’ve prepared this sample query for you. Just move the map to your neighborhood, and click Run. Don’t zoom out too much, as loading all this data might crash your browser. Here’s a lighter query (in case you get a timeout; this one doesn’t exclude private roads).

Now you have a clear map of your data. But you can’t edit it here. So first, let’s download the data. Just click “Export”, then “Download as GeoJSON”.

查看完整日记文章

OSMF Board elections

joost schouppe 于 2019年十月29日 以 English 发布 最后一次更新于2019年十一月 5日。

December is election season in the OpenStreetMap Foundation. The Board is planning the next elections already, so now seems like a good time to talk about my first year as a member of the Board.

Why being involved in OSMF matters

OpenStreetMap is a project of many hands. All around the world, people are doing amazing stuff: mapping, building community, inventing new data uses, building tools. Yet most of the visible innovation is happening on the fringes, not the core of the project. That’s normal for a community like OpenStreetMap. For example, new mappers are much more likely to convince someone to start mapping then regular ones. If only because us hard-core mappers have been stalking our friends for ages already. You won’t be getting many new open source routing planning experts on board - they’ve already seen the light. It is the people who are “on the fringes of OSM” that have the best view of where we can grow further.

And yet, OpenStreetMap isn’t run by people from the fringes, but by core volunteers. While people all over the world are developing new “osm welcoming tools”, we haven’t even started talking about integrating such a tool into osm.org. While vector tiles are now the industry standard, we don’t even have a roadmap on how to get there. Time and again, we see people ringing alarm bells about the lack of progress in the core. I believe part of the reason why this is happening, is that from the inside out, all looks like it’s going swell.

查看完整日记文章

OSMF membership rates by country

joost schouppe 于 2018年十一月20日 以 English 发布

We all know the OSMF has a small membership compared to the mapping community. Worse, it is skewed towards certain countries. You might hear people say Germans and US Americans dominate the membership.

In a perfect world, all countries have a similar participation rate to OpenStreetMap, and mappers from all countries participate in OSMF by the same degree. The first is not something that is easily changed, but the second should clearly be our ambition. In France, a discussion about this led to a recruitment campaign with the explicit goal of rebalancing. This piqued my curiosity. Oh, and it increased membership with 90 people (from a mere 42).

But numbers without context are of little use. Guillaume (user Stereo) supported the French with membership statistics, and hooked me up with a list of membership by country for all countries. Now I’d say OSMF membership would ideally reflect the mapping community - skewed slightly for countries with a bigger data-user community. Unfortunately, no thorough statistics about mappers by country is available. Fortunately, there is something close to it: “the number of daily mappers” in a country. It is not a perfect measure:

  • hdyc has a de facto “estimated home location”. This would allow to take some of the random noise out of the equasion

  • “active mappers” (people with at least three months with a mapping day) might be a better measure

  • in some cases, it’s impossible to find the country of people who only map abroad

But it’s close enough, and it’s available. Pascal Neis, deserving his last name as usual, sent me a list of all countries with the avarage number of daily mappers over the last 12 months.

Numbers with context

The easiest useful measure in this context is the membership rate, which allows to compare countries. For the world, you get 26 OSMF members for every 100 daily mappers. This rate varies from 0 in Tanzania to 94 in the US. On a map, it looks like this:

查看完整日记文章

OpenStreetMap Notes make it easy to share some info about mistakes or missing data in OpenStreetMap. It’s a very open system, allowing for posting and commenting from third party apps and even without logging in.

I’m working on an exhaustive analysis of how notes are used. Here are some prelimanry findings.

Notes are often personal

While the wiki doesn’t encourage using Notes as a personal to-do list, very many Notes get closed by the original poster. In fact, of all Notes that were posted by a logged in contributor, that are at least 90 days old, and are already closed, 50% were closed by the original mapper. The vast majority of those “self-closed” Notes (96%), never saw interaction. Notable though, is that IF there was some sort of interaction, there was a reaction by the original contributor in almost 90% of the cases.

One of the things that I want to investigate, is if these people who are closing so many of their own Notes, are also up to closing other Notes. What I would like to know is if the Maps.me surge in Notes created more note-closers, and if so if they were new to notes or not.

Maps.me is huge

When Maps.me implemented Notes into their app, the impact was huge. Basically, the number of Notes doubled overnight. The graph shows the monthly opened notes. In the first months of Maps.me Notes, the added notes were about the same as all other notes together!

查看完整日记文章

This is my position statement for the December 2017 board election.

Where I’m coming from

Since joining OpenStreetMap, I’ve found myself on a slippery slope of ever stronger engagement to the project. Not only have I been mapping at least every other day, I’ve grown into being a community organizer. At first I was mostly interested in South America, where it felt like OSM has a much larger niche to fill than in Europe. I didn’t start off as an open source and open data enthusiast, but as someone crazy about maps. As a sociologist and data analyst I was fascinated by the data and the people behind it. I liked the way OpenStreetMap could solve real problems, and enjoyed being part of those solutions. Riding on the tails of Jorieke Vyncke (current Missing Maps coordinator) and Ben Abelshausen (awesome OSM routing developer and tireless organizer), it always seemed logical that we should build the map together.

查看完整日记文章

Peter Mooney, Frank Ostermann and I first met at a workshop about Crowdsourcing in National Mapping in Leuven. There were people from national mapping agencies from around Europe, who came to talk about their experience with working with crowdsourcing. I talked about the crowdsourcer’s perspective. It was a bit frustrating to be the only OSM-community representative, as I know that we’re defined by many points of views. With Peter and Frank the conversation soon went to the science aspect of that same relation. Professional scientists find it hard to talk to OSM, and OSM people find it hard to talk to scientists. We believe we can do better. And we want to do something about it. Rather than just start doing stuff, we want to invite you to discuss this with us. Below is our line of thinking, written by the three of us together.

Problem

This initiative is based on our observations that there is room for improvement in the interactions between the academic research and OSM communities. On the one hand, the OSM community often learns late (or never) about research results generated from academic research on OSM. For example, the OSM wiki pages on academic research are likely not to be up-to-date (with the majority of entries from the years 2010/2011, and little after 2014), but nevertheless quite cluttered, containing many non-English entries, and therefore difficult to search effectively. On the other hand, the academic research community has often little information on what are important concerns for the OSM community. As a result, very often academic research is carried out on OSM in complete isolation from the OSM community itself. There has been substantial interest from the academic research community into OSM since at least 2006/2007. This interest shows no signs of abating. One must acknowledge that the incredible success story of OSM is an intriguing source of potential research for academics.

Objective:

Our initiative has therefore two main objectives:

查看完整日记文章

Over the passed year, the Belgian community was involved in organizing 10 mapathons. It is an incredibly easy thing to do, once you have the documentation in order. And once you realize you should do as little as possible - just find people who have a location and a recruiting network.

Some time ago, Pascal Neis wrote an article about new mappers recruited through classic channels, Maps.me and humanitarian mapping. I asked and got a changeset dump of all the people who participated in our mapathons.

Here’s some stats about that.

Overal, 1925 unique mappers participated in our mapathons, of which 328 were new mappers.

First, did we manage to turn them into returning mappers? Well… As could have been predicted by Pascal’s depressing numbers: not really. The data used was from December 2016. You can clearly see that the percentage having more than one mapping day drops as we approach December. That simply means you need to wait a bit before you can do a decent analysis.

image

查看完整日记文章

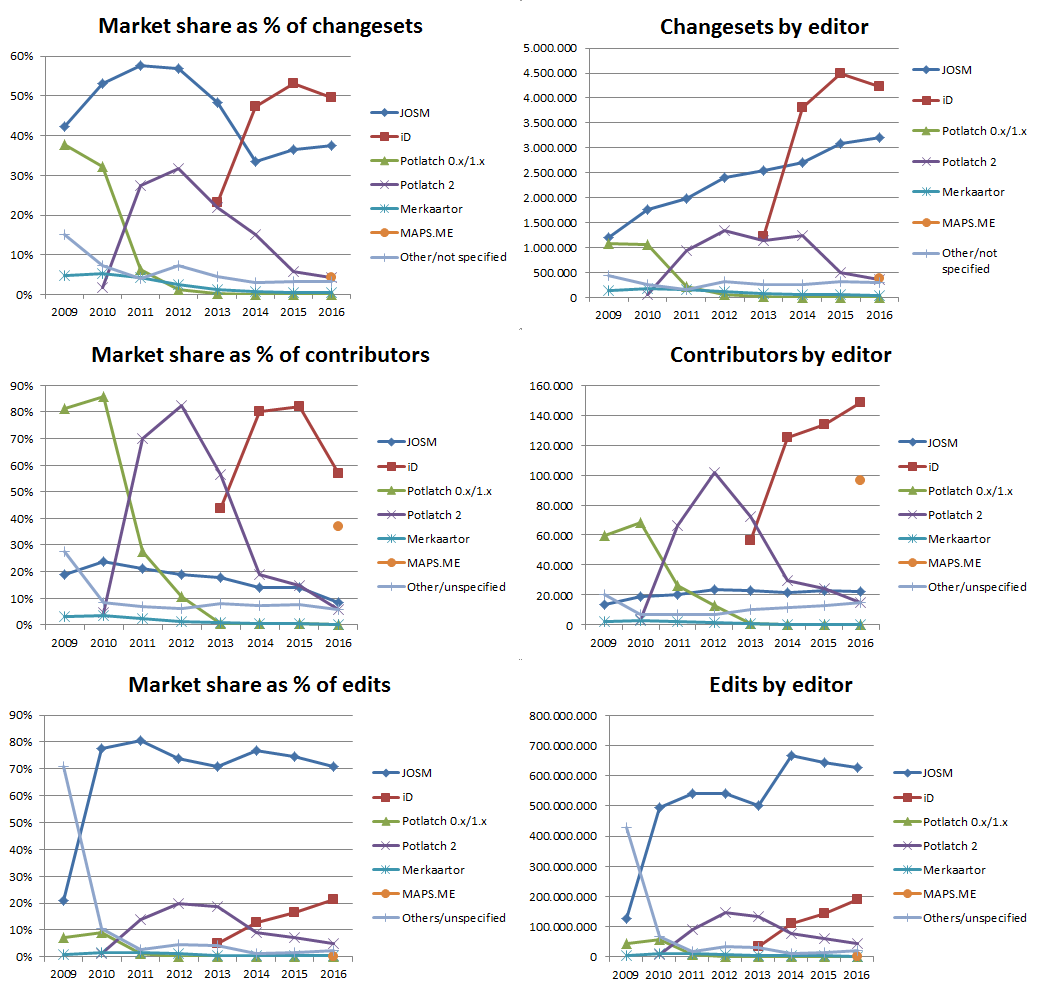
Market shares of editors

joost schouppe 于 2017年四月12日 以 English 发布

This wiki page has a nice collection of stats on editor popularity. The data is up to date, but the graphs aren’t. I’m not a big fan of the logarithmic scale either.

So here’s one graph to tell the main story.

I focused on “the big editors” to keep the graph simple. If you want more detail, just head over to the wiki page.

You can read the graph horizontally, showing first the distribution of changesets, then number of unique contributors, then total edits. On the left, market share. On the right absolute numbers.

Graph full size

查看完整日记文章

OSM & government, in Lithuania

joost schouppe 于 2017年三月 6日 以 English 发布 最后一次更新于2017年三月 7日。

When OpenStreetMap started, open geodata was basically unavailable. Some governments were quicker than others to release their data. And so some places had huge imports from the start. Whether that was a good idea or not is slowly becoming irrelevant: the map is too full for big new imports anyway. Imports are ever more exercises in conflation: merging sources and using them to validate and improve existing OSM data. The good news is that it means that often the same tools for the “initial” import can be used for keeping the data up to date. Continues synchronization between datasets changes the relation between data provider and OSM.

For a government, a complete and reliable OSM becomes a more valid tool for their projects. The synchronization processes we set up, can form the basis for an extra quality assurance (QA) channel for governments. It might even convince some agencies that there is little to be won by managing some of their data on their own.

To try and capture this changing relation, I started a thread on the talk mailing list. Mikel suggested creating a Wiki page on the subject: here it is. Meanwhile, several people have improved upon it!

During the course of the research for that page, I met Tomas Straupis. I wanted to share what he told me about what they do exactly with government data, and what their relationship is with the government.

Interview with Tomas Straupis

Here’s a general idea what we’re doing in Lithuania.

Government has datasets d1, d2… dn. OSM has one big dataset O which could be split into datasets o1, o2… om. We take datasets dx and oy which could be mapped (have similar data, like placenames, roads, lakes, rivers, etc.)

Automated importing to either direction is impossible (or not wanted by both sides). Government datasets need strict accountability (sources, documents) and responsibility. OSM has different data and simply overwriting it with government data would be bad in a lot of ways.

查看完整日记文章

Several people have written on the subject before: when you look at something like the evolution of road network length in OSM, the shape of the curve can tell you something about how complete the network is (on the condition that there are enough local mappers).

This graph shows this evolution for the main roads in Flanders.

network growth full size

You can clearly see that the larger roads were mapped faster than the smaller roads. (note: there is a bug in the OSM-history-importer which prevents deleted objects from being removed from a snapshot. This could explain the continued slight growth of main roads. When people improve roads, they will often delete small portions of them.)

Assuming they are all kind of complete now, you can show the evolution of length as a percentage of current length. This shows quite clearly that there are “mapping priorities”: the 60% completion mark comes much sooner for motorways then it does for tertiaries.

查看完整日记文章

Evolving roads

joost schouppe 于 2017年一月18日 以 English 发布 最后一次更新于2017年一月27日。

In my quest to understand the growth of OSM, I had a little fun today.

I took the 1/1/2017 full history dump for Brussels and I extracted a shapefile with all the versions of all the highway=* that ever existed.

Then I wanted to visualize it to see if there was a pattern in how the roads get mapped: “first real roads, then paths” or “everything all the time”. So I styled the paths clear green, the roads thin black and used a gray background for the current highways. Then I rendered a slide for every month.

Brussels link

It looks really cool, because it doesn’t just show the chaos of our growth. As the black roads are drawn slightly transparent and the monthly slide shows every version of the road in that month, “active areas” show up in heavy black. I think it’s really pretty.

On the occasion that it was a featured image in the Weekly OSM, I made a new version without a gray background and with a more logical image size.

查看完整日记文章

Building local mapping communities

joost schouppe 于 2016年十一月12日 以 English 发布

Community power

While building the program for State of the Map, the program committee had to say no to several people who wanted to talk about their local community – their successes and their challenges. As a kind of compensation, we added a local communities panel (video) and a local chapters congress to the program.

But during the preparation, I also got a lot of feedback from people who couldn’t make it to State of the Map: money, accidents, visa. I got feedback from Brian Pangle (UK), Felix Delattre (Nicarague), Clifford Snow (US/Seattle), Marco Antonio Frias (Bolivia), Redon Skikuli (Albania), Mohamet Lamine Ndiaye (Senegal), Yantisa Akhadi (Indonesia) and Michal Palenik (Slovakia). Most of them didn’t have a chance to be on the panel, or even make it all.

Some of their ideas did make it to the Local Chapters Congress, and helped put things in motion. For example, finally we have the option to follow comments on Diary posts! And there’s talk of putting some money into OSM.org website development for things like massive local messaging, which was a recurring theme there. That might involve helping Gravitystorm’s project to simplify the OSM.org codebase, as that would make contributing code that much easier. Also the idea to allow OSMF membership without payment was mentioned, which was an obvious frustration during the Local Chapters Congress.

What is important to me, is that it goes to show that focused community action can shift the focus of our dev team to issues that would otherwise be lower on their priorities list. I hope we can repeat efforts like this at the next SotM, hopefully even stronger.

This post does two things. First, it will give you, the local community builder, a lot of ideas about things you could do to work on a tighter and larger community. Second, it tries to set an agenda. It offers you several ideas which you could adapt, promote or realize.

Content

There are three subjects:

查看完整日记文章

Using OSM to improve government data

joost schouppe 于 2016年九月30日 以 English 发布 最后一次更新于2016年十月 4日。

Recently, I wrote about how you could use government road data to improve OpenStreetMap. Here’s a move in the other direction.

As an employee of the city of Antwerp, I was involved in the recent ‘validation’ of the Road Registry (Wegenregister) for our city. This registry is managed by the central Flemish government, but final responsibility for the content is with the municipality. Validation means the central government gives us a new dump for us to check for errors. This way of working is only a temporary situation: in the future, we will be live editing in the central database itself.

ooh!

Some background

查看完整日记文章

位置: De Kluis, Buizingen, Halle, Halle-Vilvoorde, Flemish Brabant, 1501, Belgium

Open road data for map improvement in Flanders, Belgium

joost schouppe 于 2016年八月12日 以 English 发布 最后一次更新于2017年二月 6日。

TL;DR: Government road data, processed to help you map roads in Flanders, Belgium. All the tiled layers are available for use in your favorite editing software.

About the data

The Flemish government has a large project to measure most stuff you find in the public domain, the GRB (Dutch). The data is measured to incredible accuracy, but the project is not focused on maximum recency. Update frequency is once or twice a year. When it comes to roads, only those that need an official streetname are included.

That’s a bit limited for some purposes, so they started the Wegenregister (Registry of Roads). The idea is that all roads are included, also “slow roads” (paths and tracks), private roads and even future roads. They started of with the centerlines of roads from the GRB and enriched it with National Geographic Institute (NGI) data for smaller roads. It isn’t quite finished yet: a lot of local governments must still validate the data, and there is no automatic procedure in place to feed new GRB roads to the database. So you can expect some of the “future roads” to be quite present. The NGI data is also of varying quality: it is quite complete and has generally good geometry, but it can be quite outdated.

The scope of the Wegenregister is to offer a complete road network, not navigable data. It does not include anything like access restrictions, detailed lane info or max speeds. It does contain road surface information. It is divided into segments, which go from one junction to the next. Only if a new road is added, an existing segment will be split. That means segment ID’s are relatively stable. If a segment has a change of attribute somewhere, this is dealt with by dynamic segmentation. Basically, that means you have a table saying stuff like “from meter 0 to 100 asphalt, from meter 100 to end concrete”.

Finding missing roads

查看完整日记文章