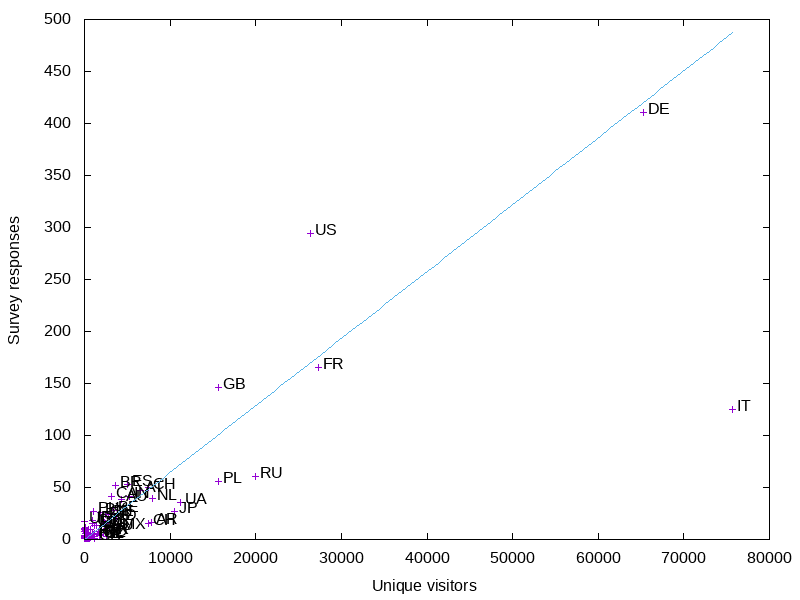
In my last post I looked at survey responses by country and their correlation with mappers eligible for a fee waver as an active contributor.
I wanted to look at the correlation with OSM.org views. I already had a full day’s worth of logs on tile.openstreetmap.org accesses, so I filtered them for requests from www.openstreetmap.org and got a per-country count. This is from December 29th, 2020. Ideally it would be from a complete week, and not a holiday, but this is the data I had downloaded.

The big outlier is Italy. It has more visits than I would expect, so I wonder if the holiday had an influence. Like before, the US is overrepresented in the results, Russia and Poland are underrepresented, and Germany is about average.
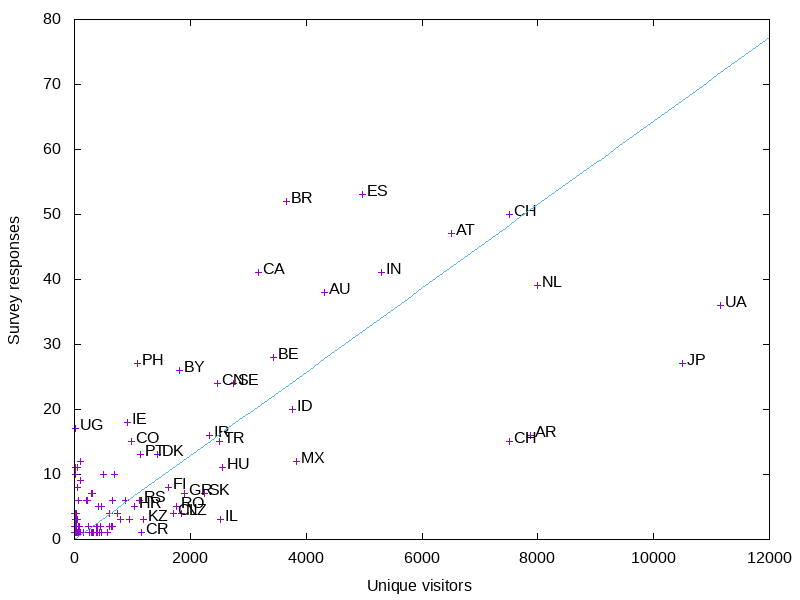
Like before, I made a graph of the smaller countries.

More small countries are above the average line - probably an influence of Italy being so low.

Discussion
Kommentti käyttäjältä Tigerfell 22. February 2021 klo 20.37
Thank you for those insights.
The second diagram shows Switzerland twice. The point at ~7400 unique visitors and 15 survey responses is actually CZ.