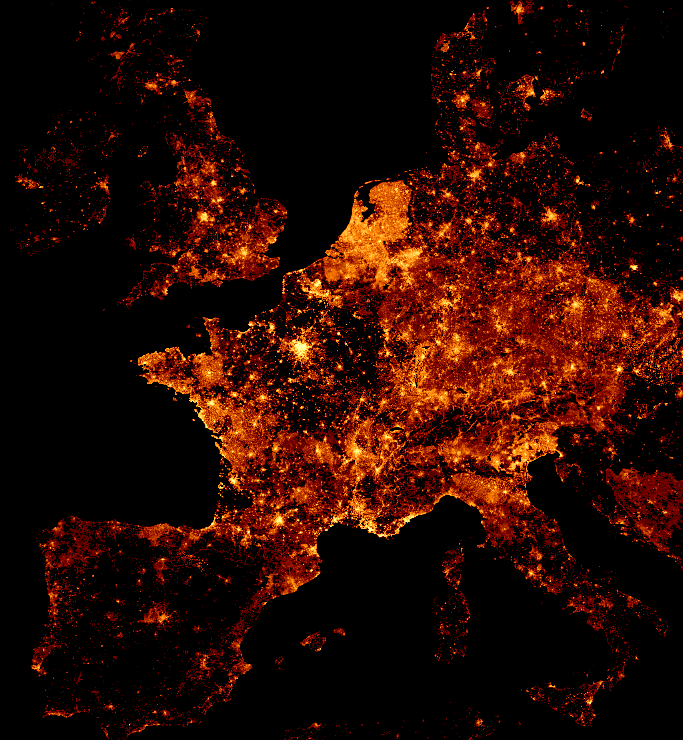
OpenStreetMap Node Density Visualized
Skrivet av tyr_asd den 27 juni 2013 på English. Uppdaterades senast 15 januari 2023.I’ve visualized OpenStreetMap’s node density from Frederik’s analysis of densely mapped locations:
 (click for uncropped image - 8192x8192, ~1MB)
Every pixel stands for a single zoom-level 13 tile. The color represents the total number of nodes in that tile. Tiles with less than 1000 nodes are not displayed. A “low-res” version of this visualization is also available, which is based on zoom-level 10 tiles: (click to enlarge)
Copying: visualizations © cc-by-sa - source data © OpenStreetMap contributors, ODbL
How-To
In case anyone is wondering how these were made: I’ve used gnuplot to create the maps, after converting the source data with a simple sed-command. Read more about the actual steps and gnuplot-commands.
Slippy Map Version
There is also a slippy map version (updated yearly)! Check it out. ;)


Diskussion
Kommentar från aseerel4c26 på 28 juni 2013 kl. 00:13
Thanks! Looks like a to be featured image to me.
Kommentar från ajmas på 28 juni 2013 kl. 13:20
Good job.
Before reading the text, the first thing that this made me think of is the “Earth Lights” image from NASA: http://visibleearth.nasa.gov/view.php?id=55167 . Comparing the two shows that the number of nodes does not necessarily correlate with the amount of light produced.
Kommentar från aseerel4c26 på 1 juli 2013 kl. 12:16
Thank you for those images! They are now featured on our wiki main page this week.
Kommentar från tyr_asd på 1 juli 2013 kl. 12:38
awesome! :)
Kommentar från sabas88 på 1 juli 2013 kl. 20:56
Awesome! Could you make a tileset (only low zooms..) like the one by MapBox on the geotagged tweets? http://www.mapbox.com/blog/visualizing-3-billion-tweets/
Kommentar från tyr_asd på 2 juli 2013 kl. 00:19
Very good idea! Here you go: http://tyrasd.github.io/osm-node-density/
Kommentar från aseerel4c26 på 2 juli 2013 kl. 02:27
@tyr_asd: wow :-)
Kommentar från max1e på 17 juni 2014 kl. 13:34
hi, can you help me with: “convert to simple, gnuplot-readable text format” but from windows? sed-command works in windows console? if yes, how add way to file file.13 ? thanks
Kommentar från tyr_asd på 17 juni 2014 kl. 14:06
max1e, yes, you should be able to install and run sed also on Windows (ask google). This visualization is done only for nodes because the raw data analysis was done (by Frederik Ramm, username: woodpeck) only for nodes. If you want also ways, you’d have to repeat the analysis step, which could be a quite extensive task, I suppose…
Kommentar från max1e på 17 juni 2014 kl. 14:26
tyr_asd, can you show me screenshot or attach file (any image hosting, or file hosting) - view of tiles.13.txt inside? (Structure) because i dont understand what done function “s/([0-9]) z=([0-9]) x=([0-9]) y=([0-9])/\3 \4 \1/’”
In windows SED - renamed file from tiles13 to files13.txt, but file inside are empty. thanks
Kommentar från max1e på 17 juni 2014 kl. 14:33
huh, problem solved. http://www.c4dru.info/showthread.php?30036-GPS-based-light-map&p=227218#post227218
maybe anybody need this for win
Kommentar från tyr_asd på 17 juni 2014 kl. 14:33
max1e, sure, I’ll send you a personal message!
Kommentar från KyL0VV på 14 januari 2023 kl. 23:23
Is there a newer version since 2020 available? …I am just curious how the entries evolved.
Kommentar från tyr_asd på 15 januari 2023 kl. 14:33
@KyZEN: The slippy map version on https://tyrasd.github.io/osm-node-density/ is updated yearly (the last update was in June/July 2022). To compare different years, use the layer selector on the top right of the page.