
My OSM node density visualization has just been updated to show the freshest OSM data!
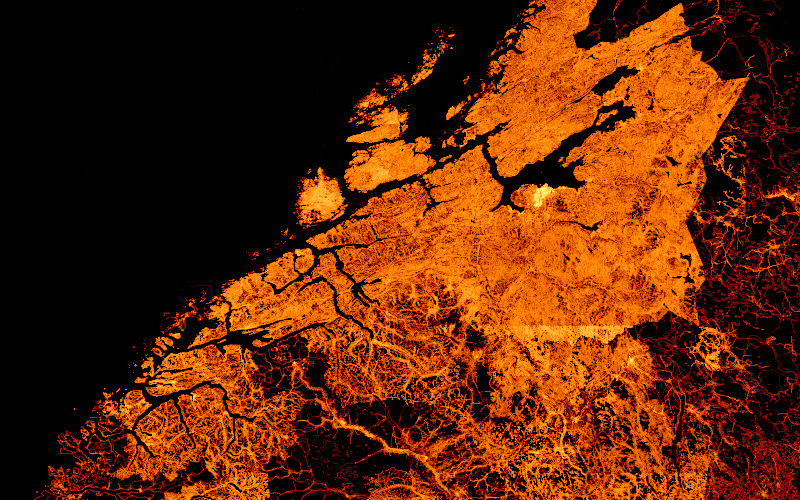
A significant difference from the 2014 edition is that the density is now calculated as OSM-nodes per m² on the ground (as opposed to nodes per projected pixel in the previous version). If you want to learn more about why this change makes a difference, I’d strongly recommend the following article by Christoph Hormann (imagico).
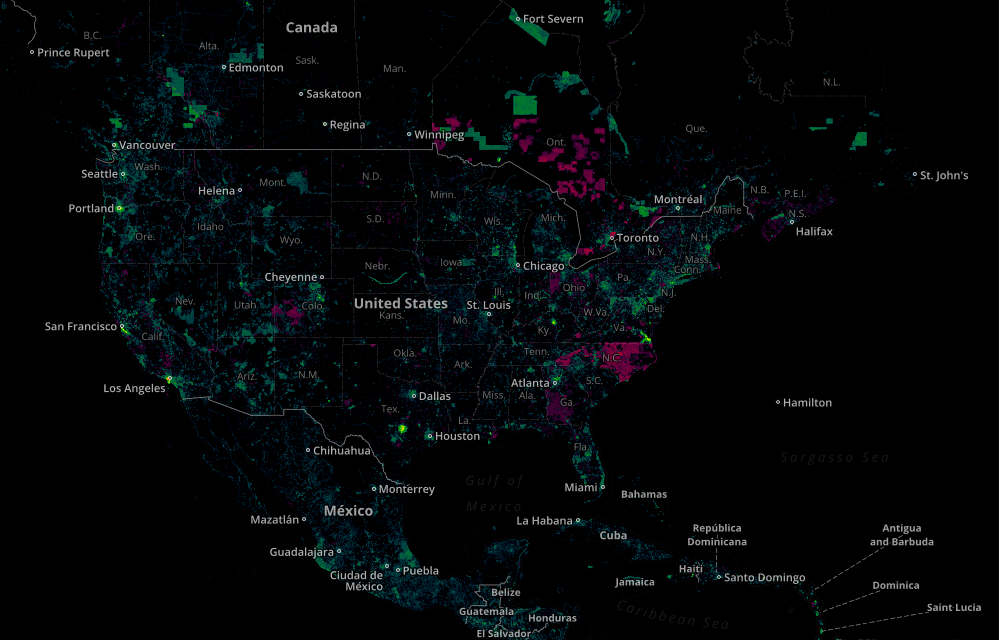
The updated slippy map lets you chose between the layers of different years (always created around end of June of each year) as well as a display of what changed during each 12 month interval. For example you can see that in North America, there were some imports as well as some major import-cleanups going on during the last year:
Last, but not least: you can now find the source code and instructions to generate all of this in the repository on github: https://github.com/tyrasd/osm-node-density/tree/gh-pages/code
Discussione
Commento di imagico il 7 luglio 2016 alle 17:40
Very nice.
The difference layers are somewhat confusing color wise - showing a color scale there would be helpful.
Commento di joost schouppe il 10 febbraio 2017 alle 17:37
Would it be very hard to get the node density of Europe on this grid? Would be kind of interesting to make a little analysis of the correlation between the two - and patterns of exceptions. Thinking about something like an analysis by clusters of squares like shown here (every slide adds or substracts 10% of the total European population)
Commento di tyr_asd il 13 febbraio 2017 alle 13:30
@joost: nope. here you go: https://gist.github.com/tyrasd/80b2cbd9a3991e9b295124c1a6165bc2. Code and freshly processed raw data is included. osmnodes-eu.geostatgrid.csv uses keys that are compatible with the grid ids from the pop dataset, but note that their “reference grid” doesn’t include cells with 0 population.
Commento di joost schouppe il 13 febbraio 2017 alle 13:41
Damn, there goes another week-end =) Thanks! Looking forward to playing around with this.
Commento di Jennings Anderson il 11 aprile 2017 alle 18:45
Martin, these are so cool!
I’m trying to re-run some of these with mbtiles and mapbox-gl for smooth zooming: http://www.townsendjennings.com/osm-node-density/#3.88/47.28/13.66
My resolution, however is nowhere as good as yours! What were the settings that you used when you generate your highest zoom-level png?
Thanks!
Commento di tyr_asd il 12 aprile 2017 alle 19:04
Jennings, I think I just run the commands as explained here (I’m not sure why it reads
zoom=16here – this should also be15or lower). That generates a 1 gigapixel (32768x32768) density map, which cut into tiles corresponds to max zoom level 7 on the slippy map: http://tyrasd.github.io/osm-node-density/#7/-7.961/-248.373/latest,placesI tried to use my tms tile source
https://s3-eu-west-1.amazonaws.com/osm-node-density/2016/{z}/{x}/{y}.pngwith mapboxgl as well, and see similarly blurry results. Not sure what’s going on. Maybe it’s related to https://github.com/mapbox/mapbox-gl-js/issues/4552?Commento di Jennings Anderson il 12 aprile 2017 alle 21:02
Thanks Martin, that’s really interesting… staying tuned.