Well, I’ve just discovered that anybody can edit like it’s wikipedia. So instead of doing homework, I’ve spent several hours fixing little things in my hometown. This is fun.
Diary Entries in English
Recent diary entries
npm install leaflet react-leaflet @types/leaflet import ‘leaflet/dist/leaflet.css’; import { MapContainer, TileLayer, GeoJSON } from ‘react-leaflet’;
<MapContainer center={[39.8283, -98.5795]} zoom={4} style={{ height: ‘400px’, width: ‘100%’ }} >
<GeoJSON data={stateGeoJSON} style={stateStyle} onEachFeature={onEachFeature} /> </MapContainer>
I used this query in overpass turbo:
[out:xml][timeout:25];
// fetch area “Kildare” to search in
{{geocodeArea:County Kildare}}->.searchArea;
// gather results
(way["highway"="tertiary"]["maxspeed"="80"](area.searchArea);
way["highway"="unclassified"]["maxspeed"="80"](area.searchArea);)->.roads;

// print results
(.roads;>;); out meta;
and loaded it directly into Josm, then replaced 80 with 60, and added maxspeed:type=IE:rural as suggested on the talk-ie list, which I hope will make the difference between “rural” local roads, and those at the edge of urban areas, obvious.
I couldn’t find any exceptions listed by Kildare County Council, so I’m reasonably confident I shouldn’t have scooped up any inappropriately, but do shout if I’m wrong.
My End Goal: Have all the ferries in the world listed in the best possible way on Openstreetmaps!
About Me
I have been a member of OpenStreetMap US for five years, engaged in fostering open data and community collaboration. My first experience with OpenStreetMap was while working in emergency management in 2010 when the Haiti earthquake occurred. As someone trained in disaster response, I watched the events in Haiti unfold and looked for ways to contribute. It was also my gateway into other open data & software communities, such as QGIS and OSGeo, which informed my educational approach during my time at the University of Arizona Libraries.
I helped host the first MappingUSA virtual conference and, in 2022, hosted the State of the Map US conference at the University of Arizona in Tucson, marking the first in-person gathering post-COVID. I currently work at Development Seed, an organization with a long-standing commitment to OpenStreetMap. I drive our team’s community strategy by supporting OpenStreetMap events and engaging with other open geo communities. My background in geospatial technology, open data advocacy, and community engagement equips me with a unique perspective to support and strengthen OSM US.
Advancing OSM US
OpenStreetMap is more than just a map—it is a platform for civic engagement, education, and open collaboration. As a board member, I would focus on:
About Me
Hey folks! I’m Gregory Power (they/them) and I’ve been a part of the map since November 2023. I am currently a Data Scientist (Contractor) for Cary, North Carolina—where I manage Cary’s Open Data Portal and other analytics infrastructure. In my spare time I enjoy learning about urban planning and equitable, multimodal infrastructure. I’m also involved with the Pedestrian Working Group, Government Working Group, and my community’s Strong Towns chapter. I enjoy contributing to the open source geospatial software community, with a soft spot for GDAL, QGIS, GRASS GIS, and DuckDB—so everyone can have the tools to understand the world around them. Even though there’s a great set of tools for us to use, it’s nothing without having an open ecosystem of data.
My Mapping
My first project in OpenStreetMap was tracing plans for Cary’s Downtown Park into OpenStreetMap. With the updated layout, Cary’s Integration and Development Team could have a basemap to put our sensor data on. Once I realized OpenStreetMap data was used by all of our applications across the town and beyond, I was hooked. I enjoy mapping multimodal transportation infrastructure, handicapped parking, and restaurants. I’ve trained team members on conducting field surveys with StreetComplete and captured street imagery with Mapillary.
As a Board Member
It’s important that communities have access to data and the ability to make changes to increase the fidelity of the data. These are the objectives I’d prioritize:
This was harder than I thought it would be. The lesson for re-drawing a road was drag-and-drop. I could not insert an extra node in the Administrative Boundary in order to truncate the triangle.
I had to create a new Administrative Boundary and relate it to the existing boundary. Then delete the node at the top of the old boundary.
Requested review as I’m not sure that is the correct or accurate way to perform the task.
Posted by Kamil Kalata on 6 February 2025 in English.

Hello!
I’ve just found out that ~2k out of ~13M relations have no type tag, ~220 of which have the type tag with lifecycle prefix or date namespace suffix, so I’ve decided to review them manually, with the ones with no tags containing the word “type” being the first, correct some mistakes (e.g. missing type=multipolygon) and delete the unnecessary relations (e.g. with duplicate tags). In case I make a mistake, please point it out on OSM Community topic or comment my changesets.
Regards
Kamil Kalata
Panoramax is a rising star at the moment, for OSM, but not only; while Mapillary goes down, sold to Facebook. In my old www.OSMgo.org, the key P showed a Mapillary picture near the actual position in the 3D rendered OSM world. As the API is gone, I replaced it with Panoramax. OSMgo was abandoned by me years ago but the server is still running. As I read more and more about Panoramax, I decided to dig out the old code and use it. First I asked in the Fediverse for help with the API and got a great and fast response, even a good example, thank you all!
There are almost to much pages about it. The real API was a bit hidden but well documented at last. The Idea of decentralised servers but a central directory is great, the Web-UI to see all pictures to. And the API got me a json list of the closest pictures, including a link to the pictures. After researching to define the radius (place_distance) and get the direction of the “shot” (feature.properties[“view:azimuth”]) my old Mapillary could be modified to show the picture in the 3D view and move the camera to see it.
Posted by Raquel Dezidério Souto on 4 February 2025 in English.
Last updated on 9 February 2025.
– Em Português
YouthMappers UFRJ Trajectory

The YouthMappers UFRJ is coordinated by Prof. Dr. Raquel Dezidério Souto (in post doctoral internship), and Prof. Dr. Manoel Fernandes, both from the Laboratory of Cartography, of the Federal University of Rio de Janeiro (GeoCart-UFRJ, Brazil), and was set up to prepare new mappers and develop collaborative mapping research with OpenStreetMap and related programs, involving the community, with members from inside and outside UFRJ, residing in Brazil and in other countries.
The initiative is part of the international YouthMappers network, a project founded by professors from the Universities of Arizona and Texas, with sponsor and support of the USAID (USA). There are currently more than 400 groups in public universities around the world.

Using OpenStreetMap (OSM) and JOSM (Java OpenStreetMap Editor) has completely transformed my perspective on places in Ghana. What used to be just names on a map are now vibrant locations I explore, analyze, and contribute to in meaningful ways.
With each mapping session, I am a digital explorer, uncovering hidden details about my country. While tracing highways, POIs, buildings, and rivers, to ensure that every corner of Ghana is well represented, I explore!. From the bustling streets of Accra to the serene landscapes of the Volta Region, my virtual travels take me everywhere without even leaving my seat.
As I explore and see places, I contribute data to solve real-world problems. Through OSM, I have contributed to flood risk assessments, improved accessibility to schools, and even helped emergency responders find critical locations. It’s amazing to know that my little edits can make a big difference in someone’s life.
Mapping is no longer just a hobby; it’s a passion, a responsibility, and a way to make a mark on the world.
One edit at a time! The journey continues!
Posted by amapanda ᚛ᚐᚋᚐᚅᚇᚐ᚜ 🏳️⚧️ on 4 February 2025 in English.

Another one got ignored today, another road left unmapped, another place erased because it wasn’t profitable enough to exist on a corporate map. No one noticed, because no one was supposed to.
They don’t talk about the missing footpaths, the streets that don’t appear because they aren’t in a government database, the communities left invisible because they don’t generate ad revenue. They don’t talk about how your map—your view of the world—is decided not by truth, but by business interests.
They call us idealists, hobbyists, dreamers. They say the world has already been mapped. But they are wrong.
We are the ones who see the gaps. We are the ones who refuse to let our neighborhoods, our histories, our stories be erased. We are the ones who put the world on the map—not for profit, but for people.
Yes, I am a mapper. My crime is that of curiosity. My crime is refusing to accept a world where only what is profitable is visible. My crime is knowing that no company, no government, no algorithm should have the power to decide what exists.
You may ignore us. You may try to replace us with AI, to wall off geography behind paywalls, to tell people that their contributions don’t matter. But you can’t stop us all. Because the world is ours to map.
After all, we are all alike. We are OpenStreetMap.
🤣 with apologies ++The Mentor++ (8 January 1986). “The Conscience of a Hacker”. Phrack, Inc. 1 (7): 3 of 10 - wikipedia
Posted by b-unicycling on 2 February 2025 in English.
Last updated on 3 February 2025.
I’m back home! All the uploads done! Yeah!
Street-level imagery
As I had written about earlier, I was on tour with actually, to be precise, one of the bands I’m in under the title/ program “The Dubliners Experience” in the Netherlands from Jan 15th to Feb 1st. The GoPro Max was our constant companion on the roof of the tour bus. It covers mostly motorways and the areas around concert venues, of course. I also walked around the campsite we stayed at (band life isn’t as glamorous as they make it out to be in the movies after all) with it, but that imagery is not super useful, I’m afraid. How much can you map in a fen, when there are not even leaves on the trees to map species…But still, the area got covered.
I was especially keen to upload to Panoramax, because the coverage was quite poor which does not mean to discredit the people who have already contributed, of course!
I’ll give you some before and after screenshots, some of which I had already shared on Mastodon yesterday.
Hi OSM folks,
Yesterday I finished mapping West Virginia’s forest landcover for OSM in 5 years! It was a big project and definitely the next one will be a bigger one but because of that I’m gonna do it in a pace that I can maintain. If I have to stop, then I stop. Well, it’s just a hobby for me. As I announced on Mapping USA, I’m mapping Pennsylvania from now on. I’m really interested in the history of that state, The Keystone State.
And yes, I just wanted to try myself out how I could map forest landcover outside of Europe. It seems everyone seems hyped and I like this!
I’m not a robot so I can’t work on it 24/7 due to my personal life and I know i’m not making a 100% accurate landcover, but hey, I learnt some tricks which I’m taking advantage of! Sometimes I also criticise the quality I do but well people usually improve as time flies.
I’d like to thank everyone in the OSM community for giving me help and guidance, and I’m sure I’ll still have questions if it comes to specific areas. :)

About me

I started mapping in June 2020 as a way to find parks and trails near my home in Redmond, Washington. My daughter loves adventures and provides huge motivation. I am a former compiler engineer and bring a passion for great tooling. I love being able to work with others on an expansive, vivid, and important project.
My mapping
Posted by TrickyFoxy on 31 January 2025 in English.
Last updated on 2 February 2025.

Today I will talk about the new version 0.8 of userscript that adds several useful features to osm.org.
You can view existing features of the script and install it on GitHub or in the OSM Wiki
⚡️ Faster rendering
My first PR was merged to openstreetmap-website code, and now the Map Data layer loads instantly. Be sure to try it. Thanks to the maintainers for help!
For the script, this means a huge acceleration in rendering large relations and GPS tracks (yes, tracks, read more!):
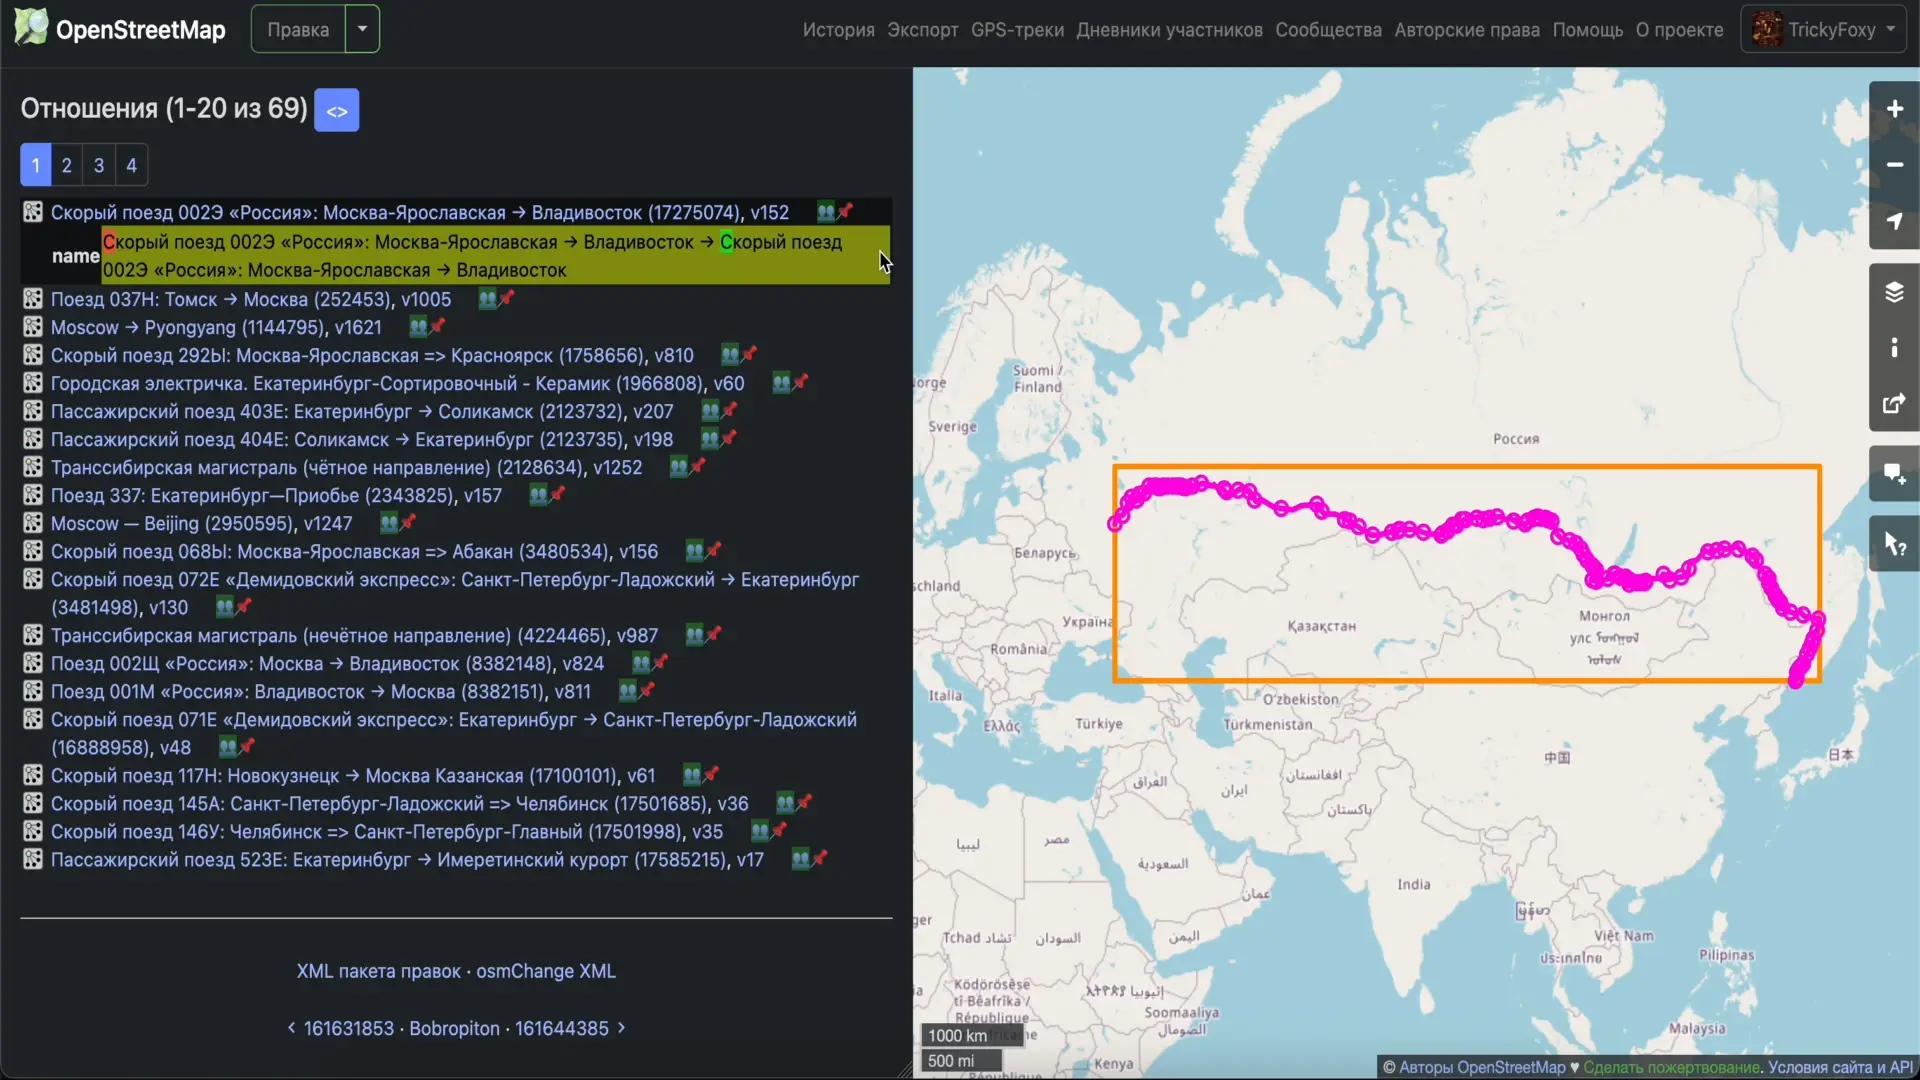
icon 👥 near relations is clickable 😉
📸 Photos from Panoramax, StreetComplete, Wikipedia Commons
Now they are displayed directly on the website. In notes, in tag history, and in changesets.
After reading this article How to transform data from NAD83 to WGS84 and based on my personal experience (taking RTK GNSS measurements with multi-frequency multi-constellation receiver hooked up to ORGN NTRIP caster referenced to NAD83(2011) epoch 2010.00), I want to share some notes.
The article suggests QGIS as a tool just to proceed with warning potential users how it could easily go wrong with no warnings. However, it doesn’t provide any methods to verify the results or the method itself except for trusting the process. Since my first attempts (independent from the content of the article) to transform my observations have failed, I was looking for the verification method and found some.
First of all, as far as I understand QGIS uses GDAL/ORG and PROJ. This toolchain has a very useful command projinfo for testing the transformation. You’d need to understand WKT output that it will spit out, but you can much easier spot the situation when it’s going to use a ballpark low-precision transformation.
For instance, this query:
projinfo -s EPSG:6319 -t EPSG:7665
among many other things spits out this string:
Conversion from NAD83(2011) (geog3D) to NAD83(2011) (geocentric) + Inverse of ITRF2008 to NAD83(2011) (1) + Inverse of WGS 84 (G1762) to ITRF2008 (1) + Conversion from WGS 84 (G1762) (geocentric) to WGS 84 (G1762) (geog3D)
It explains in fairly good detail what it’s going to do and has some useful keywords such as geog3D which means that it expects input and provides output in degrees of latitude/longitude as well as ellipsoidal height, see EPSG:6319 for details. It also mentions 0.01 m at the beginning and in the context of OPERATIONACCURACY[0.01] which is pretty self-explanatory.
Then, you can actually attempt transforming an individual set of coordinates using cs2cs. The easiest way is to throw them into its input stream like this using echo:
Cycling is not one thing
To most people cycling is just something people do as exercise and if you’ve seen one bike you’ve seen them all. To someone that has become deeply embedded into the cycling community at a national level as my hometown area has become a cycling hub for every variety of biking there is my view of biking has become quite diverse and how I’ve approached mapping cycling has matured and grown. I think a lot of people within the OSM community look at osm.wiki/Bicycle and scroll through pages and think, man it looks like you’ve got is all covered. However, I see this page I almost entirely see one type of cycling covered: Urban/Suburban Commuting.
So maybe a good place to start is to cover the variety of types of cycling that exist and how they are distinct and how they are also tangibly intertwined.
Even in listing these I tried to stop and logically break things in to categories like on-road, off-road, and closed circuit or hard-surface vs. soft surface of even high speed (sport) vs. low speed (recreation/commuting) but even here these starts to bleed together. For instance MTB racing has started to include gravel runs, so has cross country (XC), so has the Tour de France which is decidedly road.
Thus in no particular order here are some of the larger categories of biking and at a high level difference in how they function as it relates to biking.
Road Biking
Think tradition asphalt, curved handle bars, Lycra , fully human powered, and fast. From a mapping perspective this requires a lot of similar things to road mapping like speed limits but there is a particular interest in if roads have shoulders or if it’s an established mountain road that people train then there can be little difference.
Mountain Biking (MTB)

The twenty-third development diary brings substantial architectural changes to OpenStreetMap-NG, marking a pivotal moment in the project’s evolution. This update introduces MapLibre GL JS as our new mapping engine, comprehensive dark theme support, and various quality-of-life improvements that enhance both user experience and technical capabilities.
🔖 You can read other development diaries here:
osm.org/user/NorthCrab/diary/
⭐ This project is open-source — join us today:
https://github.com/openstreetmap-ng/openstreetmap-ng
🛈 This initiative is not affiliated with the OpenStreetMap Foundation.
Video Summary
Feel invited to watch this video summary that demonstrates improvements in action. The showcase provides a look at the new MapLibre GL JS integration, dark theme functionality, and various interface refinements that enhance the OpenStreetMap-NG experience.
⬇ Click the image below to play
Hello OSM Community,
I’m still working on capturing 360° images of the city of Salzburg for Mapillary and Panoramax. My goal is to enhance OSM data in Salzburg, especially in areas with notes that could be resolved with better visual context - something 360° images can provide.
Progress as of now

Route Planning Challenges
So, i tried some tools to plan a route efficiently to cover as many streets as possible without overlapping - essentially the Chinese Postman Problem.
- Bikerouter: manual tedious labour involved to cover every street
- everystreet challenge: no GPX download, so useless. No developtment.
- RunEveryStreet: More automated approach, but key features missing and some bugs, and I didn’t get a response to my suggestions unfortunately.
Unfortunately, none of these tools fully met my needs, so i did it more practical.