
I’ve undertaken the task of mapping Inveralmond Industrial Estate, which lies close to my location but is currently not mapped in any great detail. While most buildings were drawn onto the map fifteen years ago, only about 25 businesses have been added since then—and I contributed half a dozen of those entries just a few months ago. At least two businesses that were added years ago have since closed permanently. Last Sunday, I conducted a preliminary survey of the area, capturing dashcam footage that helped me compile a list of fifty additional unmapped businesses. This number will likely grow substantially, as I left out the minor roads in the estate during this initial pass. My estimate is that the final count could easily reach one hundred businesses. This pattern reflects a broader issue: industrial areas consistently suffer from poor mapping coverage. That’s my take on it anyway from the areas I’ve looked at. I’m currently testing the iOS app Every Door, and plan to conduct comprehensive field mapping in the coming weeks. My goal is to document everything from the largest manufacturing facilities down to the most modest infrastructure, including grit bins. osm.org/#map=16/56.41782/-3.47651
Users' Diaries
Recent diary entries

Maalin dhaweyd ayaa la i mamnuucay. Runtii waan ka xumahay. Waxaan dareemay murugo iyo qoomamo badan. Madaxa ayaa iga laalaada ceeb.

-
Rapport de cartographie locale - Village de Fareins (Ain)
Présentation générale
La commune de Fareins, située dans l’Ain en région Auvergne-Rhône-Alpes, compte environ 2 500 habitants. Son tissu urbain se compose d’un centre historique, de quartiers résidentiels, de zones rurales et d’infrastructures variées. Le travail de cartographie locale vise à fournir une représentation détaillée et à jour de la commune sur OpenStreetMap.
Historique de la cartographie à Fareins
Début des contributions en janvier 2022 avec la création de mon compte OSM, initialement orienté vers les bornes incendies via OSM Hydrant.
Reprise active de la cartographie en juin 2024, avec des contributions hebdomadaires et une couverture étendue sur des thèmes plus variés
Activité parallèle d’un autre contributeur local, ArthµrC2016, sur certains thèmes similaires.
Données cartographiées
Cartographie considérée très complète sur les thèmes suivants :
Réseaux électriques : HTA, BT, poteaux, transformateurs, lampadaires
Voirie : rues, trottoirs, passages piétons, ralentisseurs, limitations de vitesse
Mobilier urbain : bancs, panneaux, poubelles, défibrillateurs, aires de jeux
Points d’eau incendie : bornes, bouches, extincteurs
Bâti : maisons, piscines, haies, projets de construction, etc
Végétation : arbres isolés, haies, bois, fossés, ruisseaux
Points d’intérêt : commerces, panneaux d’information, plans, œuvres d’art, points de vue
Méthodologie et outils
Relevés sur le terrain avec prise de notes manuscrites et numériques
Utilisation de Mapillary, Baba, iD Editor, Map Complete et Street Complete
Consultation de données ouvertes (Volta, cadastre, orthophotos IGN)
Dernières zones d’amélioration
Clôtures (en cours)
Détails précis (Boites aux lettres privées, bouches d’égouts)
Mise à jour périodique des projets urbains
Vérification continue de l’actualité des données
Avancées récentes
Pas grand chose…
Conclusion et perspectives

Es ist ein gewaltiger Unterschied, ob man Blog-Beiträge erst nach zwei Klicks oder schon prominent auf der eigenen Benutzerseite eingeblendet sieht. Dann sollte man Blog-Beiträge auch löschen können. Was hier nun bei OSM gemacht wurde, ist für mich ein absolutes Unding.
Es kann durchaus sein, dass ich deshalb alle Blogbeiträge mit je einem Punkt für Überschrift und Inhalt ersetze.
Welcher Teufel hat jene geritten, die auf solche Ideen kamen?

The Community Bonding Period officially wrapped up on June 1, and the coding phase is already off to a solid start.
During CBP, we successfully migrated the legacy 3DMR repo from GitLab to the new official GitHub repo. This cleanup made collaboration and discussions way easier. I also dove into pygltflib to handle glTF files, experimented with the obj2gltf converter.
I spent a good chunk of time mapping with the iD and JOSM editors, focusing on features from my home village. It’s oddly satisfying to see buildings you’ve walked past for years show up as polygons and tags. I plan to keep adding more local features whenever time allows. I experimented rendering both my mapped data and some iconic Indian landmarks using OSM2World, let’s just say it made my village look unexpectedly fancy.
With coding underway, my first priority was building out the test suite. The project didn’t have one before, which would’ve made every upgrade feel like defusing a bomb in the dark. I’ve opened a PR for it, currently under review. While working on this, I found a few minor bugs lurking quietly in the codebase for years, filed them, fixed them, and thankfully had those PRs merged.
The Django 5.2 upgrade is nearly done and is clinging on my forked repo as i am writting this… Most dependency updates and refactoring are complete. Now I’m exploring edge cases, making sure nothing’s hiding in the shadows ready to throw a 500 error when nobody’s looking. Once the test suite merges, we’ll be in a much safer spot to modernize the stack.
On the personal side: I’m a long-distance runner and have been using summer break to improve my endurance. I run 5 to 7 kilometers daily, a good counterbalance to all the screen time, long debugging sessions, and occasional existential dread that come with working through old code 🙃. I also have a few books lined up, both fiction and non-fiction, hoping to get through them—unless I get distracted again.

Für wen? Alle Wesen von 12-18 Jahre
Wann? vom 23.05. bis 18.07.2025 alle 2 Wochen Freitags 16-20 Uhr
Wo? In der machBar auf dem freiLand-Gelände beim Hauptbahnhof Potsdam
Digitale Karten sind eine tolle Hilfe, um sich zurecht zu finden. Deshalb ist es wichtig, dass sie für alle zugänglich sind und die Infos enthalten, die wir brauchen. Mit der OpenStreetMap können wir selbst dazu beitragen, dass das so ist!
Wir schauen uns gemeinsam an, wie die Karte funktioniert, was wir damit alles machen können und werden selbst aktiv: wir kartieren Dinge, die uns interessieren und korrigieren Fehler – jedes Mal auf eine andere Weise. Wir können uns eigene Karten zusammenbauen, uns von der Karte Fragen beantworten lassen und sogar Dinge mit unseren Lieblings-Karteninhalten gestalten.
23.05.: Einführung und Mapping mit der App StreetComplete
06.06.: Mapping mit FieldPapers, Übertragung in die OSM mit JOSM
20.06.: Input zu räumlichen Barrieren und Mapping für die Wheelmap Potsdam
04.07.: Beispiel-Rundgang und eigene Themen-Karte erstenn mit Umap
18.07.: Kartendaten als Vektorgrafik ausspielen und sticken/lasern/plotten
Mehr Infos und Anmeldung: https://jugendhackt.org/lab/potsdam/
Best

Recently, I needed to open my OpenStreetMap profile—just to right-click and save my own profile picture for use on another platform.
Thanks to the newly redesigned OSM profile layout, I was greeted by a few new statistics—one of which showed how many comments my last diary post had received. While I was busy grabbing my avatar, I couldn’t help but notice that my recent diary post had garnered quite a bit of discussion.
To my surprise, at least two commenters pointed out the same thing : they suggested it would be more intuitive if the value reflected actual months, rather than “something that roughly represents the progress of the year in base-10.”
That got me thinking—how hard would it be to convert that base-10 year-progress value into something closer to a conventional month (base-12)?
Step 1: Extract the Year
To compute the year from an OSM timestamp (Unix time), we start by offsetting it from a known reference point—specifically, the Unix timestamp for the start of the year 2000.
(osm_timestamp - 946692127) / 31556952
- 946692127 is the Unix timestamp for Sat Jan 01 2000 02:02:07 GMT+0000. This value was arbitrarily chosen by me (high accuracy isn’t necessary; I just needed a reference point roughly around the year 2000).
- 31556952 is the average number of seconds in a year (365.2425 days).
This gives us a floating-point number: the integer part is the year offset from 2000.
To extract the integer part (representing the year), we can substring the first 2 character:
substring(divided_by(osm_timestamp - 946692127, 31556952), 0, 2)
Oh wait!
While writing this post, I stumbled upon a small but interesting bug from the initial release.
Originally, the code extracted the first three characters of the computed year value. This worked fine for double-digit years like 2010 and beyond—10.5 would yield “10.”, which was sufficient for identifying the year and using the decimal as a makeshift separator between year and month.
OVERVIEW
I stumbled across a website which hosts every single Soviet military map 1:200k from 1985.
I plan to analyze each quadrant starting from the top left corner to the western side of russia, and map any unmapped settlements, buildings or other features.
I will update the post as time goes on, this is a VERY-long-term project.
QUADRANTS
CURRENTLY W.I.P.
- R60-05 to R6-35
PROGRESS SO FAR
-
R60-05 (~80%)
-
R60-11 (~30%)
STATS
Day 1
Changes - 167
Changes/day -167
Changesets - 2
Changesets/day - 2
Changes/changeset - 83,5
Quadrants - 1,1/3520 (3,13%)
Quadrants/day - 1,1
Km^2 - 2955.04/17 100 000 (0.017%)
DIARY
DAY 1
Added all the peaks, ridges, survey points which were on land in quadrants R60-05 and R60-011. Added capes, fixed lake names and added missing homes (how anyone can live there is beyond me). Tommorrow I will focus on adding rivers, the survey points along the rivers, adding the singular road and the rest of the capes

As OpenStreetMap becomes a central part of global mapping infrastructure, it’s worth asking:
Are corporations offering as much or more as they are getting from their OSM involvement?
Some corporations benefit enormously from OSM using it to build commercial services, run logistics, and analyze market data. But these same companies often have access to large, rich datasets, especially from telemetry and user behavior, that are far beyond what the average contributor can collect.
If shared, such data could dramatically improve OSM’s accuracy, completeness, and utility. But how much of this data is actually being shared?
There’s a tension here between open knowledge and proprietary advantage. While some companies do contribute back through edits, funding, or tools, the scale of these contributions doesn’t always match the value extracted.
This leads to deeper questions: - Is the current model of corporate engagement with OSM sustainable? - Are the benefits of the open model being eroded when sharing isn’t reciprocal? - Could new norms or frameworks encourage deeper, more equitable collaboration?
The OSM community thrives on openness, transparency, and volunteerism. As more private actors join, the long-term health of the ecosystem may depend on whether those values are upheld not just by individuals, but by corporations as well.
Телефон
My parents had rented a barge to explore the Barrow Navigation in Ireland for a week. I joined them on three days to capture water-level imagery with my GoPro (and to catch up with them as well). There are unfortunately 1.7km missing where the battery of the camera ran out, and there was no place to moore to exchange or charge it.
All the images are uploaded to Mapillary (Sequence key for 1st sequence: l2Yx6tGPdI9qRUAwZLvTFe) and Panoramax (Sequence key for 1st sequence: 7fe2a04f-e18c-4cf3-8bb5-48af1d1cf7ad); there were 2,446 in total, if I remember correctly. This being Ireland, of course it rained for some bits of it, so the images between Carlow and Athy are a bit blurry.

in welke categorie valt het Wisselbospad in Merelbeke ? Dat bestaat uit horizontale houten planken, licht meanderend tussen achtertuinen en lichte bebossing

hi

2025年5月24日(土)神奈川県横浜市の上大岡でOpenStreetMapマッピングパーティーを開催しました。上大岡駅東口から南東方面、谷戸地形の調査散策。 Field Papersとmuramotoさん作成の地形3Dプリントを参考にしながら、崖に張り付いた谷戸的住宅街などを確認しました。高い場所へ移動して谷戸の全景をチェック、「黒船来航」で人が集まったとされる丘に移動し、横浜港方面を眺めました。その後、富士見ポイントなどに寄りつつ散策、上大岡駅に戻りました。

Když se v pozdním jaru nebo na začátku léta procházíte po loukách v okolí Lipna, Frymburka nebo Českého Krumlova, občas si všimnete neznatelných změn v porostu, rovných linií, kde vegetace roste s jinou intenzitou. Nejde si nevšimnout ani častých betonových skruží uprostřed polí, nebo pastvin.
Jsou to stopy minulosti, kdy se ve velkém prováděly meliorace s cílem odvodnit zamokřené louky a přeměnit je v intenzivně využívanou zemědělskou půdu. Dnes tyto bývalé, ale stále funkční zásahy do vodního režimu krajiny znovu otevírají diskuse. Nejen mezi vědci a ochranáři, ale i mezi zemědělci a krajinnými inženýry.
Dědictví meliorací
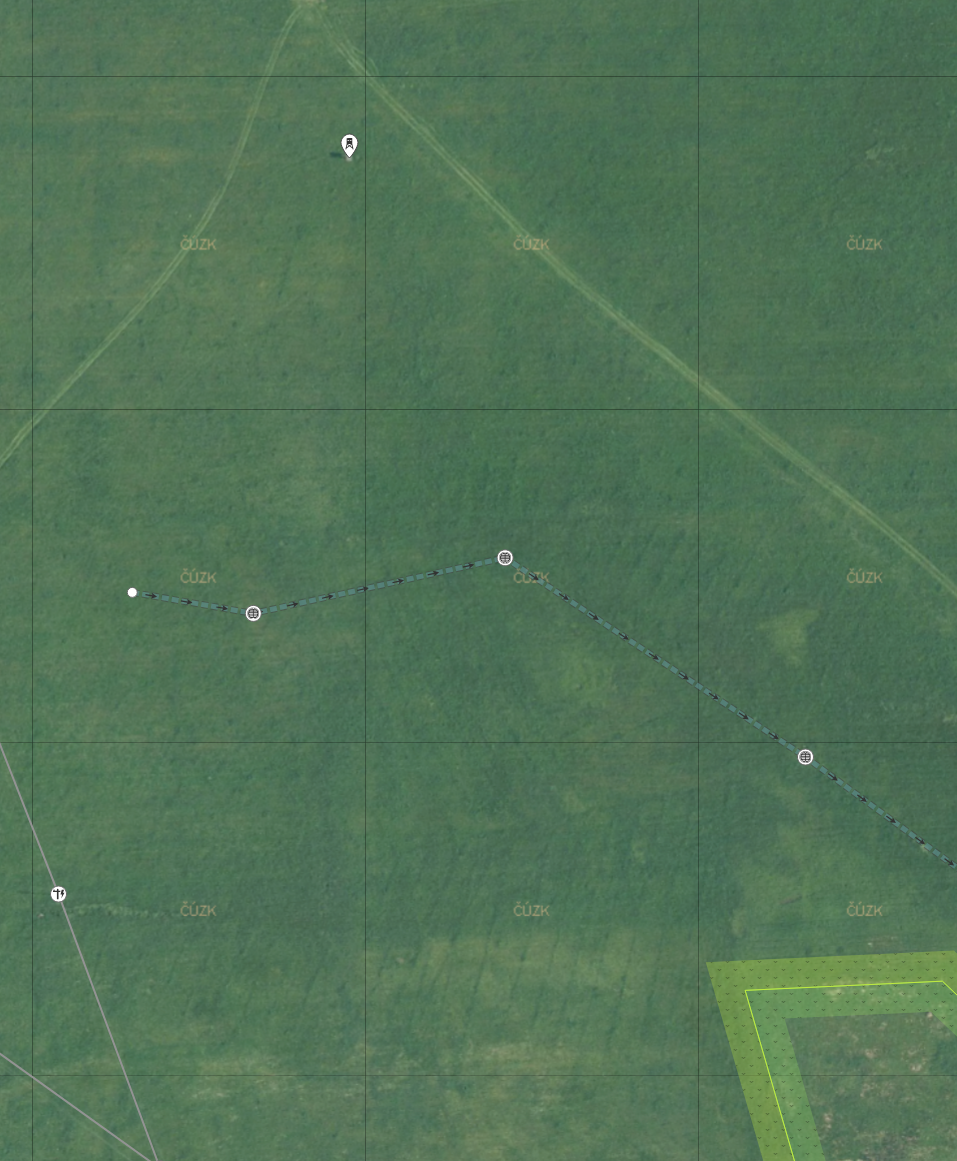
- Na obrázku je výřez louky s patrnými liniemi melioračních brázd u osady Skláře, nedaleko Hořic na Šumavě. Středem louky prochází hlavní odvodňovací kanál, který je osazen skružemi. Ty slouží především jako přístup k čištění. Někdy je z kanálů vyvedena voda na povrch za účelem napáječky dobytka
JOSM + плагины:
Hallo Community,
Ich habe momentan folgendes Problem. Durch unseren Ort ist ein Mapper gegangen und hat 40 von ca. 250 Hydranten gemappt. Diese sind zum Teil fehlerhaft (Falscher Standort, Falsche Typ, kein Hydrant nur Entlüftung, Löschbrunnen als Hydrant deklariert, usw…) von den 40 Stück sind es ca. 10 Stück. Die ganzen Überfluhrhydranten ca. 20 Stück ohne Rohrdurchmesser angegeben. Somit für die Feuerwehr nur bedingt brauchbar. Da der Führungskraft wieder nachsehen muss welche Leitung es ist, um das bereite gestellte Löschwasser zu berechnen.
Ich wollte darauf hin die 40 Hydranten löschen, dies wurde mir leider untersagt. Stattdessen soll ich diese alle Richtig stellen. Dies sehe ich aber nicht als meine Job. Ich kann dies gerne an die Gemeinde weitergeben, diese wollen aber dann einen Lohn für die Arbeiten. Wer übernimmt die Kosten dafür?
Was hilft es uns, wenn nur 40 von ca. 250 Hydranten in dem System sind, wir aber seit 10 Jahren ein anderes System verwenden hier jeden Hydranten mit Bild, GPS Daten, Kennzeichnung ob Einsatzbereit, usw. hinterlegt haben. Diese Jährlich überprüfen und an den Wasserzweckverand Rückmelden mit Schäden.
Die Nachbarwehren nutzen Openfiremap, diese wird mit den OSM Daten gespeist. Sollte nun eine Nachbarwehr zu uns zum Einsatz kommen und sieht in Ihrem System, das ein Hydrant in der Nähe ist, dies aber nicht stimmt?? Weil es nur eine Entlüftung ist oder ein Löschbrunnen.
Wir sind der Meinung das solche Daten von Leuten gemappt werden sollen, die eine Ahnung haben, was Sie machen. Somit die ~Zuständige~ Gemeinde / Stadt / Feuerwehr.
Was ist eure Meinung dazu??

Apprendre à utiliser JOSM
- Installation JOSM et CREATION d’un Compte sur Openstreetmap
- PRISE EN MAIN DE JOSM ET CARTOGRAPHIE DES BATIMENTS
- Cartographie avec JOSM: l’outil Fusionner les chemins
- Tuto Extrême - JOSM en 3 minutes
- How To Get Started with JOSM
- Cartographie avec JOSM: mode Tracer
- Configuration JOSM
- PRISE EN MAIN DE JOSM ET CARTOGRAPHIE DES BATIMENTS
- JOSM - Voir les adresses en couleurs !
- Autres vidéos