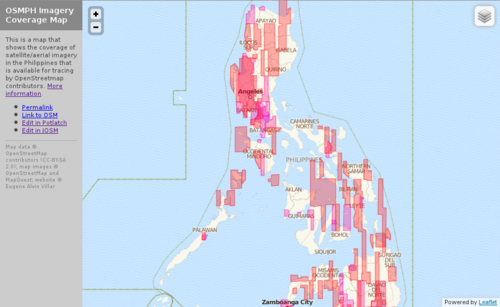
I created a visualization showing the node density of OSM data in the Philippines taken from the 2012-01-02 Geofabrik extract. Each pixel (in the full-sized image) represents a 0.01°×0.01° degree square or approximately 1 square kilometer. Brighter pixels represent areas with higher node counts.

The edges of available satellite imagery at that time is quite visible in some areas like Pangasinan, Cebu, Bukidnon, and Davao del Sur. As expected, brighter areas are places where there is a large amount of editing and with a large population.